Jakub Kicinski

Developments in Linux kernel networking accomplished by many excellent developers and as remembered by Andew L, Eric D, Jakub K and Paolo A.

Intro

The end of the Linux v6.2 merge coincided with the end of 2022, and the v6.8 window had just begun, meaning that during 2023 we developed for 6 kernel releases (v6.3 – v6.8). Throughout those releases netdev patch handlers (DaveM, Jakub, Paolo) applied 7243 patches, and the resulting pull requests to Linus described the changes in 6398 words. Given the volume of work we cannot go over every improvement, or even cover networking sub-trees in much detail (BPF enhancements… wireless work on WiFi 7…). We instead try to focus on major themes, and developments we subjectively find interesting.

Core and protocol stack

Some kernel-wide winds of development have blown our way in 2023. In v6.5 we saw an addition of SCM_PIDFD and SO_PEERPIDFD APIs for credential passing over UNIX sockets. The APIs duplicate existing ones but are using pidfds rather than integer PIDs. We have also seen a number of real-time related patches throughout the year.

v6.5 has brought a major overhaul of the socket splice implementation. Instead of feeding data into sockets page by page via a .sendpage callback, the socket .sendmsg handlers were extended to allow taking a reference on the data in struct msghdr. Continuing with the category of “scary refactoring work” we have also merged overhaul of locking in two subsystems – the wireless stack and devlink.

Early in the year we saw a tail end of the BIG TCP development (the ability to send chunks of more than 64kB of data through the stack at a time). v6.3 added support for BIG TCP over IPv4, the initial implementation in 2021 supported only IPv6, as the IPv4 packet header has no way of expressing lengths which don’t fit on 16 bits. v6.4 release also made the size of the “page fragment” array in the skb configurable at compilation time. Larger array increases the packet metadata size, but also increases the chances of being able to use BIG TCP when data is scattered across many pages.

Networking needs to allocate (and free) packet buffers at a staggering rate, and we see a continuous stream of improvements in this area. Most of the work these days centers on the page_pool infrastructure. v6.5 enabled recycling freed pages back to the pool without using any locks or atomic operations (when recycling happens in the same softirq context in which we expect the allocator to run). v6.7 reworked the API making allocation of arbitrary-size buffers (rather than pages) easier, also allowing removal of PAGE_SIZE-dependent logic from some drivers (16kB pages on ARM64 are increasingly important). v6.8 added uAPI for querying page_pool statistics over Netlink. Looking forward – there’s ongoing work to allow page_pools to allocate either special (user-mapped, or huge page backed) pages or buffers without struct page (DMABUF memory). In the non-page_pool world – a new slab cache was also added to avoid having to read struct page associated with the skb heads at freeing time, avoiding potential cache misses.

Number of key networking data structures (skb, netdevice, page_pool, sock, netns, mibs, nftables, fq scheduler) had been reorganized to optimize cacheline consumption and avoid cache misses. This reportedly improved TCP RPC performance with many connections on some AMD systems by as much as 40%.

In v6.7 the commonly used Fair Queuing (FQ) packet scheduler has gained built-in support for 3 levels of priority and ability to bypass queuing completely if the packet can be sent immediately (resulting in a 5% speedup for TCP RPCs).

Notable TCP developments this year include TCP Auth Option (RFC 5925) support, support for microsecond resolution of timestamps in the TimeStamp Option, and ACK batching optimizations.

Multi-Path TCP (MPTCP) is slowly coming to maturity, with most development effort focusing on reducing the features gap with plain TCP in terms of supported socket options, and increasing observability and introspection via native diag interface. Additionally, MPTCP has gained eBPF support to implement custom packet schedulers and simplify the migration of existing TCP applications to the multi-path variant.

Transport encryption continues to be very active as well. Increasing number of NICs support some form of crypto offload (TLS, IPsec, MACsec). This year notably we gained in-kernel users (NFS, NVMe, i.e. storage) of TLS encryption. Because kernel doesn’t have support for performing the TLS handshake by itself, a new mechanism was developed to hand over kernel-initiated TCP sockets to user space temporarily, where a well-tested user space library like OpenSSL or GnuTLS can perform a TLS handshake and negotiation, and then hand the connection back over to the kernel, with the keys installed.

The venerable bridge implementation has gained a few features. Majority of bridge development these days is driven by offloads (controlling hardware switches), and in case of data center switches EVPN support. Users can now limit the number of FDB and MDB auto-learned entries and selectively flush them in both bridge and VxLAN tunnels. v6.5 added the ability to selectively forward packets to VxLAN tunnels depending on whether they had missed the FDB in the lower bridge.

Among changes which may be more immediately visible to users – starting from v6.5 the IPv6 stack no longer prints the “link becomes ready” message when interface is brought up.

The AF_XDP zero-copy sockets have gained two major features in 2023. In v6.6 we gained multi-buffer support which allows transferring packets which do not fit in a single buffer (scatter-gather). v6.8 added Tx metadata support, enabling NIC Tx offloads on packets sent on AF_XDP sockets (checksumming, segmentation) as well as timestamping.

Early in the year we merged specifications and tooling for describing Netlink messages in YAML format. This work has grown to cover most major Netlink families (both legacy and generic). The specs are used to generate kernel ops/parsers, the uAPI headers, and documentation. User space can leverage the specs to serialize/deserialize Netlink messages without having to manually write parsers (C and Python have the support so far).

Device APIs

Apart from describing existing Netlink families, the YAML specs were put to use in defining new APIs. The “netdev” family was created to expose network device internals (BPF/XDP capabilities, information about device queues, NAPI instances, interrupt mapping etc.)

In the “ethtool” family – v6.3 brough APIs for configuring Ethernet Physical Layer Collision Avoidance (PLCA) (802.3cg-2019, a modern version of shared medium Ethernet) and MAC Merge layer (IEEE 802.3-2018 clause 99, allowing preemption of low priority frames by high priority frames).

After many attempts we have finally gained solid integration between the networking and the LED subsystems, allowing hardware-driven blinking of LEDs on Ethernet ports and SFPs to be configured using Linux LED APIs. Driver developers are working through the backlog of all devices which need this integration.

In general, automotive Ethernet-related contributions grew significantly in 2023, and with it, more interest in “slow” networking like 10Mbps over a single pair. Although the Data Center tends to dominate Linux networking events, the community as a whole is very diverse.

Significant development work went into refactoring and extending time-related networking APIs. Time stamping and time-based scheduling of packets has wide use across network applications (telcos, industrial networks, data centers). The most user visible addition is likely the DPLL subsystem in v6.7, used to configure and monitor atomic clocks and machines which need to forward clock phase between network ports.

Last but not least, late in the year the networking subsystem gained the first Rust API, for writing PHY drivers, as well as a driver implementation (duplicating an existing C driver, for now).

Removed

Inspired by the returning discussion about code removal at the Maintainer Summit let us mention places in the networking subsystem where code was retired this year. First and foremost in v6.8 wireless maintainers removed a lot of very old WiFi drivers, earlier in v6.3 they have also retired parts of WEP security. In v6.7 some parts of AppleTalk have been removed. In v6.3 (and v6.8) we have retired a number of packet schedulers and packet classifiers from the TC subsystem (act_ipt, act_rsvp, act_tcindex, sch_atm, sch_cbq, sch_dsmark). This was partially driven by an influx of syzbot and bug-bounty-driven security reports (there are many ways to earn money with Linux, turns out 🙂) Finally, the kernel parts of the bpfilter experiment were removed in v6.8, as the development effort had moved to user space.

Community & process

The maintainers, developers and community members had a chance to meet at the BPF/netdev track at Linux Plumbers in Richmond, and the netdev.conf 0x17 conference in Vancouver. 2023 was also the first time since the COVID pandemic when we organized the small netconf gathering – thanks to Meta for sponsoring and Kernel Recipes for hosting us in Paris!

We have made minor improvements to the mailing list development process by allowing a wider set of folks to update patch status using simple “mailbot commands”. Patch authors and anyone listed in MAINTAINERS for file paths touched by a patch series can now update the submission state in patchwork themselves.

The per-release development statistics, started late in the previous year, are now an established part of the netdev process, marking the end of each development cycle. They proved to be appreciated by the community and, more importantly, to somewhat steer some of the less participatory citizens towards better and more frequent contributions, especially on the review side.

A small but growing number of silicon vendors have started to try to mainline drivers without having the necessary experience, or mentoring needed to effectively participate in the upstream process. Some without consulting any of our documentation, others without consulting teams within their organization with more upstream experience. This has resulted in poor quality patch sets, taken up valuable time from the reviewers and led to reviewer frustration.

Much like the kernel community at large, we have been steadily shifting the focus on kernel testing, or integrating testing into our development process. In the olden days the kernel tree did not carry many tests, and testing had been seen as something largely external to the kernel project. The tools/testing/selftests directory was only created in 2012, and lib/kunit in 2019! We have accumulated a number of selftest for networking over the years, in 2023 there were multiple large selftest refactoring and speed up efforts. Our netdev CI started running all kunit tests and networking selftests on posted patches (although, to be honest, selftest runner only started working in January 2024 🙂).

syzbot stands out among “external” test projects which are particularly valuable for networking. We had fixed roughly 200 syzbot-reported bugs. This took a significant amount of maintainer work but in general we find syzbot bug reports to be useful, high quality and a pleasure to work on.

6.3: https://lore.kernel.org/all/20230221233808.1565509-1-kuba@kernel.org/ 6.4: https://lore.kernel.org/all/20230426143118.53556-1-pabeni@redhat.com/ 6.5: https://lore.kernel.org/all/20230627184830.1205815-1-kuba@kernel.org/ 6.6: https://lore.kernel.org/all/20230829125950.39432-1-pabeni@redhat.com/ 6.7: https://lore.kernel.org/all/20231028011741.2400327-1-kuba@kernel.org/ 6.8: https://lore.kernel.org/all/20240109162323.427562-1-pabeni@redhat.com/

The LWN's development statistics are being published at end of each release cycle for as long as I can remember (Linux 6.3 stats). Thinking back, I can divide the stages of my career based on my relationship with those stats. Fandom; aspiring; success; cynicism; professionalism (showing the stats to my manager). The last one gave me the most pause.

Developers will agree (I think) that patch count is not a great metric for the value of the work. Yet, most of my managers had a distinct spark in their eye when I shared the fact that some random API refactoring landed me in the top 10.

Understanding the value of independently published statistics and putting in the necessary work to calculate them release after release is one of many things we should be thankful for to LWN.

Local stats

With that in mind it's only logical to explore calculating local subsystem statistics. Global kernel statistics can only go so far. The top 20 can only, by definition, highlight the work of 20 people, and we have thousands of developers working on each release. The networking list alone sees around 700 people participate in discussions for each release.

Another relatively recent development which opens up opportunities is the creation of the lore archive. Specifically how easy it is now to download and process any mailing list's history. LWN stats are generated primarily based on git logs. Without going into too much of a sidebar – if we care about the kernel community not how much code various corporations can ship into the kernel – mailing list data mining is a better approach than git data mining. Global mailing list stats would be a challenge but subsystems are usually tied to a single list.

netdev stats

During the 6.1 merge window I could no longer resist the temptation and I threw some Python and the lore archive of netdev into a blender. My initial goal was to highlight the work of people who review patches, rather than only ship code, or bombard the mailing list with trivial patches of varying quality. I compiled stats for the last 4 release cycles (6.1, 6.2, 6.3, and 6.4), each with more data and metrics. Kernel developers are, outside of matters relating to their code, generally quiet beasts so I haven't received a ton of feedback. If we trust the statistics themselves, however — the review tags on patches applied directly by networking maintainers have increased from around 30% to an unbelievable 65%.

We've also seen a significant decrease in the number of trivial patches sent by semi-automated bots (possibly to game the git-based stats). It may be a result of other push back against such efforts, so I can't take all the full credit :)

Random example

I should probably give some more example stats. The individual and company stats generated for netdev are likely not that interesting to a reader outside of netdev, but perhaps the “developer tenure” stats will be. I calculated those to see whether we have a healthy number of new members.

Time since first commit in the git history for reviewers
 0- 3mo   |   2 | *
 3- 6mo   |   3 | **
6mo-1yr   |   9 | *******
 1- 2yr   |  23 | ******************
 2- 4yr   |  33 | ##########################
 4- 6yr   |  43 | ##################################
 6- 8yr   |  36 | #############################
 8-10yr   |  40 | ################################
10-12yr   |  31 | #########################
12-14yr   |  33 | ##########################
14-16yr   |  31 | #########################
16-18yr   |  46 | #####################################
18-20yr   |  49 | #######################################

Time since first commit in the git history for authors
 0- 3mo   |  40 | **************************
 3- 6mo   |  15 | **********
6mo-1yr   |  23 | ***************
 1- 2yr   |  49 | ********************************
 2- 4yr   |  47 | ###############################
 4- 6yr   |  50 | #################################
 6- 8yr   |  31 | ####################
 8-10yr   |  33 | #####################
10-12yr   |  19 | ############
12-14yr   |  25 | ################
14-16yr   |  22 | ##############
16-18yr   |  32 | #####################
18-20yr   |  31 | ####################

As I shared on the list – the “recent” buckets are sparse for reviewers and more filled for authors, as expected. What I haven't said is that if one steps away from the screen to look at the general shape of the histograms, however, things are not perfect. The author and the reviewer histograms seem to skew in the opposite directions. I'll leave to the reader pondering what the perfect shape of such a graph should be for a project, I have my hunch. Regardless, I'm hoping we can learn something by tracking its changes over time.

Fin

To summarize – I think that spending a day in each release cycle to hack on/generate development stats for the community is a good investment of maintainer's time. They let us show appreciation, check our own biases and by carefully selecting the metrics – encourage good behavior. My hacky code is available on GitHub, FWIW, but using mine may go against the benefits of locality? LWN's code is also available publicly (search for gitdm, IIRC).

NIC drivers pre-allocate memory for received packets. Once the packets arrive NIC can DMA them into the buffers, potentially hundreds of them, before host processing kicks in.

For efficiency reasons each packet-processing CPU (in extreme cases every CPU on the system) will have its own set of packet queues, including its own set of pre-allocated buffers.

The amount of memory pre-allocated for Rx is a product of:

  • buffer size
  • number of queues
  • queue depth

A reasonable example in data centers would be:

8k * 32 queues * 4k entries = 1GB

Buffer size is roughly dictated by the MTU of the network, for a modern datacenter network 8k (2 pages) is likely a right ballpark figure. Number of queues depends on the number of cores on the system and the request-per-second rate of the workload. 32 queues is a reasonable choice for the example (either 100+ threads or a network-heavy workload).

Last but not least – the queue depth. Because networking is bursty, and NAPI processing is at the whim of the scheduler (the latter is more of an issue in practice) the queue depths of 4k or 8k entries are not uncommon.

Can we do better?

Memory is not cheap, having 1GB of memory sitting around unused 99% of the time has a real cost. If we were to advise a NIC design (or had access to highly flexible devices like the Netronome/Corigine NICs) we could use the following scheme to save memory:

Normal processing rarely requires queue depth of more than 512 entries. We could therefore have smaller dedicated queues, and a larger “reserve” – a queue from which every Rx queue can draw, but which requires additional synchronization on the host side. To achieve the equivalent of 4k entries we'd only need:

8k * 32 queues * 512 entries + 8k * 1 reserve * 4k entries = 160MB

The NIC would try to use the 512 entries dedicated to each queue first, but if they run out (due to a packet burst or a scheduling delay) it could use the entries from the reserve. Bursts and latency spikes are rarely synchronized across the queues.

Can we do worse?

In practice memory savings are rarely top-of-mind for NIC vendors. Multiple drivers in Linux allocate a set of rings for each thread of the CPU. I can only guess that this is to make sure iperf tests run without a hitch...

As we wait for vendors to improve their devices – double check the queue count and queue size you use are justified (ethtool -g / ethtool -l).

Kernel TLS implements the record encapsulation and cryptography of the TLS protocol. There are four areas where implementing (a portion of) TLS in the kernel helps:

  • enabling seamless acceleration (NIC or crypto accelerator offload)
  • enabling sendfile on encrypted connections
  • saving extra data copies (data can be encrypted as it is copied into the kernel)
  • enabling the use of TLS on kernel sockets (nbd, NFS etc.)

Kernel TLS handles only data records turning them into a cleartext data stream, all the control records (TLS handshake etc.) get sent to the application via a side channel for user space (OpenSSL or such) to process. The first implementation of kTLS was designed in the good old days of TLS 1.2. When TLS 1.3 came into the picture the interest in kTLS had slightly diminished and the implementation, although functional, was rather simple and did not retain all the benefits. This post covers developments in the Linux 5.20 implementation of TLS which claws back the performance lost moving to TLS 1.3. One of the features we lost in TLS 1.3 was the ability to decrypt data as it was copied into the user buffer during read. TLS 1.3 hides the true type of the record. Recall that kTLS wants to punt control records to a different path than data records. TLS 1.3 always populates the TLS header with application_data as the record type and the real record type is appended at the end, before record padding. This means that the data has to be decrypted for the true record type to be known.

Problem 1 – CoW on big GRO segments is inefficient

kTLS was made to dutifully decrypt the TLS 1.3 records first before copying the data to user space. Modern CPUs are relatively good at copying data, so the copy is not a huge problem in itself. What’s more problematic is how the kTLS code went about performing the copy. The data queued on TCP sockets is considered read-only by the kernel. The pages data sits in may have been zero-copy-sent and for example belong to a file. kTLS tried to decrypt “in place” because it didn’t know how to deal with separate input/output skbs. To decrypt “in place” it calls skb_cow_data(). As the name suggests this function makes a copy of the memory underlying an skb, to make it safe for writing. This function, however, is intended to be run on MTU-sized skbs (individual IP packets), not skbs from the TCP receive queue. The skbs from the receive queue can be much larger than a single TLS record (16kB). As a result TLS would CoW a 64kB skb 4 times to extract the 4 records inside it. Even worse if we consider that the last record will likely straddle skbs so we need to CoW two 64kB skbs to decrypt it “in place”. The diagram below visualizes the problem and the solution. SKB CoW 
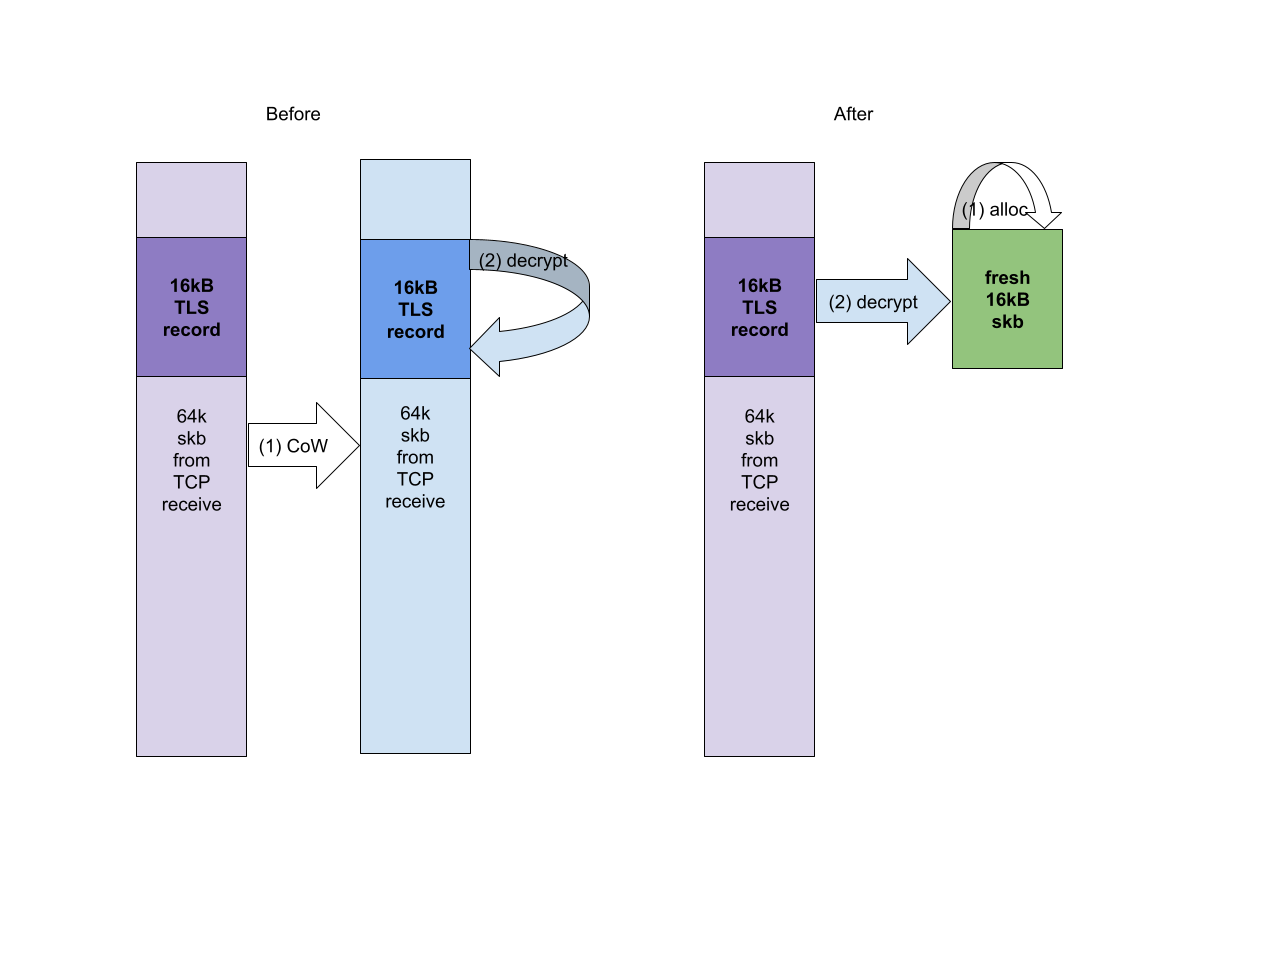
The possible solutions are quite obvious – either create a custom version of skb_cow_data() or teach TLS to deal with different input and output skbs. I opted for the latter (due to further optimizations it enables). Now we use a fresh buffer for the decrypted data and there is no need to CoW the big skbs TCP produces. This fix alone results in ~25-45% performance improvement (depending on the exact CPU SKU and available memory bandwidth). A jump in performance from abysmal to comparable with the user space OpenSSL.

Problem 2 – direct decrypt

Removing pointless copies is all well and good, but as mentioned we also lost the ability to decrypt directly to the user space buffer. We still need to copy the data to user space after it has been decrypted (A in the diagram below, here showing just a single record not full skb). SKB direct decrypt 
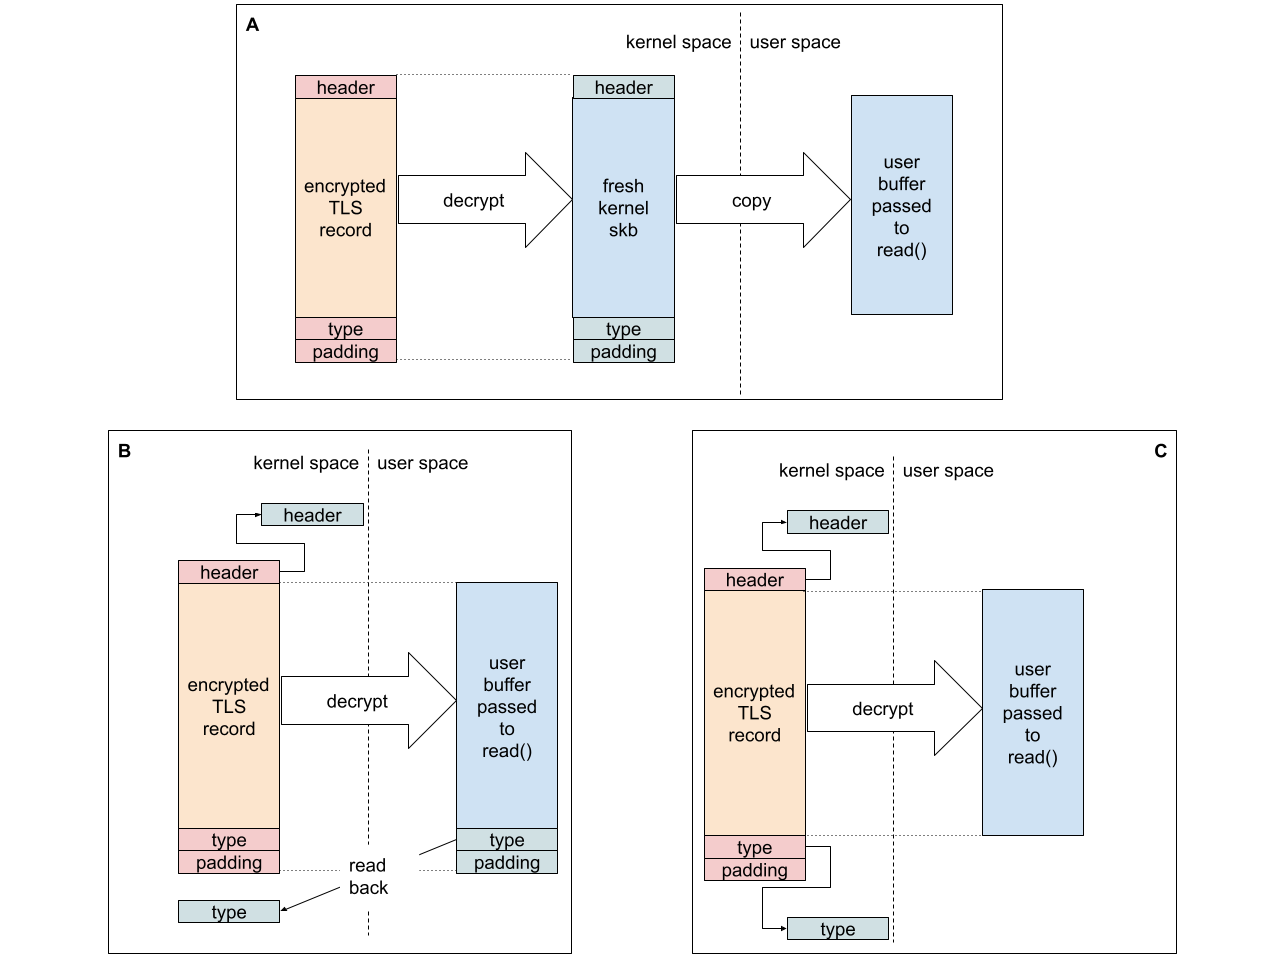
We can’t regain the full efficiency of TLS 1.2 because we don’t know the record type upfront. In practice, however, most of the records are data/application records (records carrying the application data rather than TLS control traffic like handshake messages or keys), so we can optimize for that case. We can optimistically decrypt to the user buffer, hoping the record contains data, and then check if we were right. Since decrypt to a user space buffer does not destroy the original encrypted record if we turn out to be wrong we can decrypting again, this time to a kernel skb (which we can then direct to the control message queue). Obviously this sort of optimization would not be acceptable in the Internet wilderness, as attackers could force us to waste time decrypting all records twice. The real record type in TLS 1.3 is at the tail of the data. We must either trust that the application will not overwrite the record type after we place it in its buffer (B in the diagram below), or assume there will be no padding and use a kernel address as the destination of that chunk of data (C). Since record padding is also rare – I chose option (C). It improves the single stream performance by around 10%.

Problem 3 – latency

Applications tests have also showed that kTLS performs much worse than user space TLS in terms of the p99 RPC response latency. This is due to the fact that kTLS holds the socket lock for very long periods of time, preventing TCP from processing incoming packets. Inserting periodic TCP processing points into the kTLS code fixes the problem. The following graph shows the relationship between the TCP processing frequency (on the x axis in kB of consumed data, 0 = inf), throughput of a single TLS flow (“data”) and TCP socket state. TCP CWND SWND 
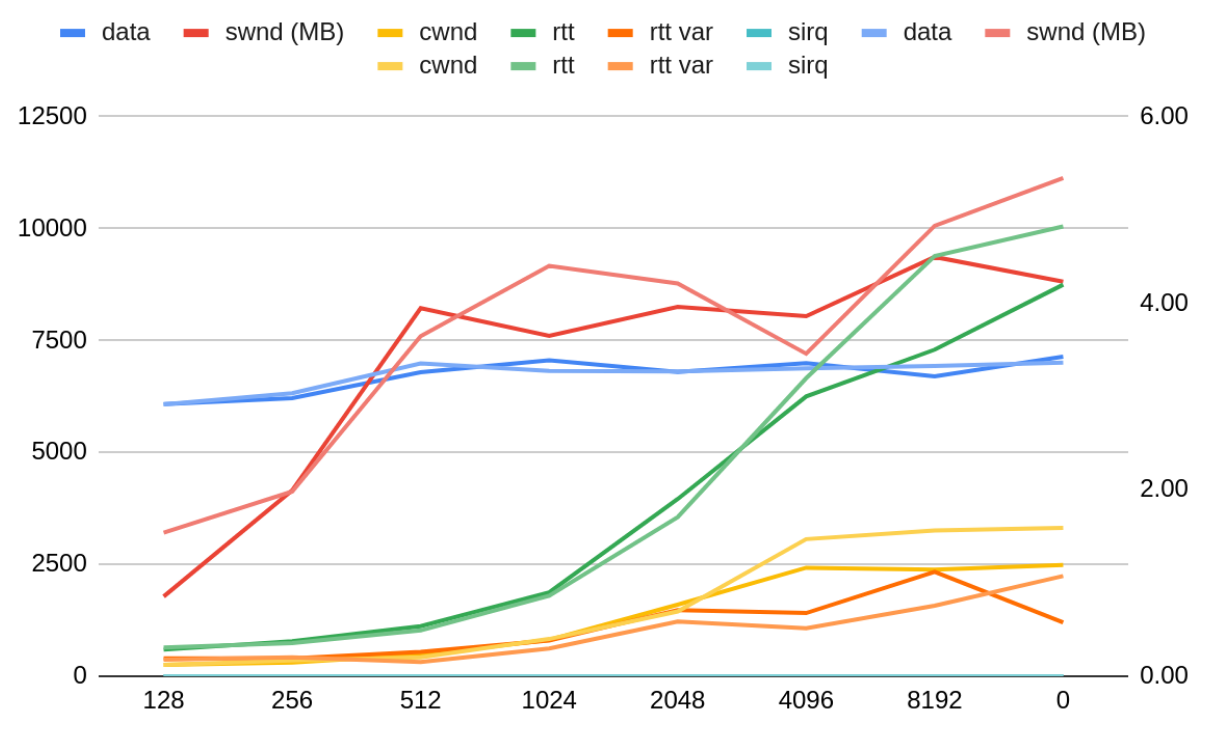
The TCP-perceived RTT of the connection grows the longer TLS hogs the socket lock without letting TCP process the ingress backlog. TCP responds by growing the congestion window. Delaying the TCP processing will prevent TCP from responding to network congestion effectively, therefore I decided to be conservative and use 128kB as the TCP processing threshold. Processing the incoming packets has the additional benefit of TLS being able to consume the data as it comes in from the NIC. Previously TLS had access to the data already processed by TCP when the read operation began. Any packets coming in from the NIC while TLS was decrypting would be backlogged at TCP input. On the way to user space TLS would release the socket lock, allowing the TCP backlog processing to kick in. TCP processing would schedule a TLS worker. TLS worker would tell the application there is more data.

In light of ongoing work to improve the TCP Tx zero-copy efficiency [1] one begins to wonder what can be done on the Rx side. Tx zero-copy is generally easier to implement because it requires no extra HW support. It's primarily a SW exercise in keeping references to user data rather than owning a copy of it.

[1] https://lore.kernel.org/all/cover.1653992701.git.asml.silence@gmail.com/

There had been efforts to support direct Rx to user space buffers by performing header-data splitting in the HW and sending headers (for kernel consumption) to a different buffer than the data. There are two known implementations which depend on header-data splitting (HDS).

First one, which is upstream today [2] depends on data payloads being received in page-sized chunks and mapping (mmap'ing?) the data into the process's virtual address space. Even though modifying the virtual address map is not cheap this scheme works well for large transfers. Importantly applications which use zero-copy are often more DRAM bandwidth constrained than CPU bound. Meaning that even for smaller transfers they may prefer to burn extra cycles modifying page tables than copying data and using up the precious DRAM transfers.

[2] https://lwn.net/Articles/752188/

The second approach is to pre-register user memory and let the NIC DMA the data directly there [3]. The memory in this case can be main DRAM or accelerator memory, that's not really important for us here. The model is similar to that of AF_XDP UMEMs. It still depends on header-data split as we don't want the application to be able to modify the headers, as they flow thru the networking stack and crash the kernel. Additionally the device must provide sufficient flow steering to be able to direct traffic for an application to its buffers / queues – we don't want the data to end up in memory of the wrong application. Once the TCP stack is done processing the headers, it simply tells the application where the data is.

[3] https://lore.kernel.org/netdev/20200727224444.2987641-1-jonathan.lemon@gmail.com/

Apart from the ability to direct the data to memory other than DRAM (compute accelerators, disks) the second approach has the advantage of not requiring page table changes and neatly page-sized payloads. It is harder to implement in SW because the stack does not necessarily have access to the payload memory. Although netgpu/zctap patches have stalled the idea may have sufficient merit to eventually come to fruition.

Looking ahead

Both of the approaches described above deal with packet-sized chunks of data. Admittedly some HW supports data coalescing (GRO-HW/LRO) but it's limited in size, best effort, latency inducing and generally unproven at scale.

Given that we already modify the HW to support zero-copy Rx (HDS for the former case, HDS+steering for the latter) what modifications would help us get to the next level? The data coalescing can certainly be improved.

LRO depends on intelligence in the NIC and maintaining state about connections which always poses scaling challenges. At the same time modern applications most often know the parameters of the transfer upfront, so they can put processing hints in the packet.

The receiver needs to know (1) which memory pool / region to place the data into and (2) at what offset. We can assume the sender gets these parameters thru the RPC layer. Sender can insert the placement information into the packet it sends. Either wrapped in a UDP header in front of the TCP header, or as a TCP option.

One useful modification may be to express the offset in terms of the TCP sequence number. Instead of providing the absolute offset where the packet data has to land (i.e. “data of this packet has to land in memory X at offset Y”) provide a base TCP sequence number and offset. The destination address would then be computed as

address = mem_pool[packet.dma.mem_id].base + 
          packet.dma.offset +
          packet.tcp.seq_no - packet.dma.base_tcp_seq

This simplifies the sender's job as it no longer has to change the offset as it breaks up a TSO super-frame into MTU-sized segments.

Last thing – we must protect applications from rogue writes. This can be done by programming an allow list of flow to memory pool pairs into the NIC. Unfortunately the full list scales linearly with the number of flows. A better approach would be to depend on a security protocol like Google's PSP [4]. PSP hands out association IDs to the senders, and only after authentication. The PSP IDs are much smaller (4B) than a IPv6 flow key (36B) if we have to keep a full list. We can try to be clever about how we hand them out – for instance allocating the “direct write” IDs from high numbers and less trusted connections from low numbers. We can also modify PSP to maintain a key per memory pool rather than per device, or incorporate the memory region ID in the key derivation algorithm. I'm not sufficiently crypto-savvy to know if the latter would weaken the protection too much.

[4] https://raw.githubusercontent.com/google/psp/main/doc/PSP_Arch_Spec.pdf

To sum up in the scheme I'm dreaming up we add the following fields after the PSP header:

  • 16b – memory id – ID of the region;
  • 64b – base offset – absolute offset within the memory region;
  • 32b – TCP sequence number base for the transfer.

Since we have 16 extra bits to round up to full 128b header we can consider adding a generation number for the memory region. This could be useful if memory region configuration / page table update is asynchronous so that we can post the read request before NIC confirmed the configuration is complete. In most cases configuration should be done by the time the data arrives, if it's not we can fall back to non-zero-copy TCP.

I don't work for Netronome/Corigine any more but it's certainly something their HW can easily support with a FW update. Much like PSP itself. What an amazing piece of HW that is...

Cross-posting my blog post about TCP overload investigation, I didn't know how to add pictures here :( https://developers.facebook.com/blog/post/2022/04/25/investigating-tcp-self-throttling-triggered-overload/

In Linux 5.13 ethtool gains an interface for querying IEEE and IETF statistics. This removes the need to parse vendor specific strings in ethtool -S.

Status quo

Linux has two sources of NIC statistics, the common interface stats (which show up in ifconfig, ip link, sysfs and few other places) and ethtool -S. The former – common interface stats – are a mix of basic info (packets, bytes, drops, errors in each direction) and a handful of lower level stats like CRC errors, framing errors, collisions or FIFO errors. Many of these statistics became either irrelevant (collisions) or semantically unclear (FIFO errors) in modern NICs.

This is why deployments increasingly depend on ethtool -S statistics for error tracking. ethtool -S is a free form list of stats provided by the driver. It started out as a place for drivers to report custom, implementation specific stats, but ended up also serving as a reporting place for new statistics as the networking standards developed.

Sadly there is no commonality in how vendors name their ethtool statistics. The spelling and abbreviation of IEEE stats always differ, sometimes the names chosen do not resemble the standard names at all (reportedly because vendors consider those names “too confusing” for the users). This forces infrastructure teams to maintain translations and custom per-vendor logic to scrape ethtool -S output.

What changed

Starting with Linux 5.6 Michal Kubecek has been progressively porting ethtool from ioctls to a more structured and extensible netlink interface. Thanks to that we can now augment the old commands to carry statistics. When user specifies -I | --include-statistics on the command line (or the appropriate flag in netlink) kernel will include relevant statistics in its response, e.g. for flow control:

 # ethtool -I -a eth0
 Pause parameters for eth0:
 Autonegotiate:    off
 RX:        off
 TX:        on
 Statistics:
   tx_pause_frames: 25545561
   rx_pause_frames: 0

General statistics such as PHY and MAC counters are now available via ethtool -S under standard-based names though a new --groups switch, e.g.:

 # ethtool -S eth0 --groups eth-mac
 Standard stats for eth0:
 eth-mac-FramesTransmittedOK: 902623288966
 eth-mac-FramesReceivedOK: 28727667047
 eth-mac-FrameCheckSequenceErrors: 1
 eth-mac-AlignmentErrors: 0
 eth-mac-OutOfRangeLengthField: 0

Each of the commands supports JSON-formatted output for ease of parsing (--json).

So little, so late

Admittedly the new interface is quite basic. It mostly includes statistics provided in IEEE or IETF standards, and NICs may report more interesting data. There is also no metadata about “freshness” of the stats here, or filtering built into the interface.

The starting point is based on fulfilling immediate needs. We hope the interfaces will be extended as needed. Statistics can be made arbitrarily complex, so after a couple false-starts with complex interfaces we decided to let the use cases drive the interface.

It’s also very useful to lean on the standards for clear definition of the semantics. Going forward we can work with vendors on codifying the definitions of other counters they have.

List of currently supported stats

IEEE 802.3 attributes::

 30.3.2.1.5 aSymbolErrorDuringCarrier
 30.3.1.1.2 aFramesTransmittedOK
 30.3.1.1.3 aSingleCollisionFrames
 30.3.1.1.4 aMultipleCollisionFrames
 30.3.1.1.5 aFramesReceivedOK
 30.3.1.1.6 aFrameCheckSequenceErrors
 30.3.1.1.7 aAlignmentErrors
 30.3.1.1.8 aOctetsTransmittedOK
 30.3.1.1.9 aFramesWithDeferredXmissions
 30.3.1.1.10 aLateCollisions
 30.3.1.1.11 aFramesAbortedDueToXSColls
 30.3.1.1.12 aFramesLostDueToIntMACXmitError
 30.3.1.1.13 aCarrierSenseErrors
 30.3.1.1.14 aOctetsReceivedOK
 30.3.1.1.15 aFramesLostDueToIntMACRcvError
 
 30.3.1.1.18 aMulticastFramesXmittedOK
 30.3.1.1.19 aBroadcastFramesXmittedOK
 30.3.1.1.20 aFramesWithExcessiveDeferral
 30.3.1.1.21 aMulticastFramesReceivedOK
 30.3.1.1.22 aBroadcastFramesReceivedOK
 30.3.1.1.23 aInRangeLengthErrors
 30.3.1.1.24 aOutOfRangeLengthField
 30.3.1.1.25 aFrameTooLongErrors

 30.3.3.3 aMACControlFramesTransmitted
 30.3.3.4 aMACControlFramesReceived
 30.3.3.5 aUnsupportedOpcodesReceived
 
 30.3.4.2 aPAUSEMACCtrlFramesTransmitted
 30.3.4.3 aPAUSEMACCtrlFramesReceived

 30.5.1.1.17 aFECCorrectedBlocks
 30.5.1.1.18 aFECUncorrectableBlocks

IETF RMON (RFC 2819)

 etherStatsUndersizePkts
 etherStatsOversizePkts
 etherStatsFragments
 etherStatsJabbers

 etherStatsPkts64Octets
 etherStatsPkts65to127Octets
 etherStatsPkts128to255Octets
 etherStatsPkts256to511Octets
 etherStatsPkts512to1023Octets
 etherStatsPkts1024to1518Octets
 (incl. further stats for jumbo MTUs)

Kernel side changes: https://git.kernel.org/pub/scm/linux/kernel/git/netdev/net-next.git/commit/?id=8203c7ce4ef2840929d38b447b4ccd384727f92b

Recent months saw a lot of changes in the venerable NAPI polling mechanism, which warrants a write up.

NAPI primer

NAPI (New API) is so old it could buy alcohol in the US – which is why I will not attempt a full history lesson. It is, however, worth clearing up one major misconception. The basic flow of NAPI operation does not involve any explicit processing delays.

Before we even talk about how NAPI works, however, we need a sidebar on software interrupts.

Software interrupts (softirq) or bottom halves are a kernel concept which helps decrease interrupt service latency. Because normal interrupts don't nest in Linux, the system can't service any new interrupt while it's already processing one. Therefore doing a lot of work directly in an IRQ handler is a bad idea. softirqs are a form of processing which allows the IRQ handler to schedule a function to run as soon as IRQ handler exits. This adds a tier of “low latency processing” which does not block hardware interrupts. If software interrupts start consuming a lot of cycles, however, kernel will wake up a ksoftirq thread to take over the I/O portion of the processing. This helps back-pressure the I/O, and makes sure random threads don't get their scheduler slice depleted by softirq work.

Now that we understand softirqs, this is what NAPI does:

  1. Device interrupt fires
  2. Interrupt handler masks the individual NIC IRQ which has fired (modern NICs mask their IRQs automatically)
  3. Interrupt handler “schedules” NAPI in softirq
  4. Interrupt handler exits
  5. softirq runs NAPI callback immediately (or less often in ksoftirqd)
  6. At the end of processing NAPI re-enables the appropriate NIC IRQ again

As you can see there is no explicit delay from IRQ firing to NAPI, or extra batching, or re-polling built in.

Problem

NAPI was designed several years before Intel released its first multi-core CPU. Today systems have tens of CPUs and all of the cores can have dedicated networking queues. Experiments show that separating network processing from application processing yields better application performance. That said manual tuning and CPU allocation for every workload is tedious and often not worth the effort.

In terms of raw compute throughput having many cores service interrupts means more interrupts (less batching) and more cache pollution. Interrupts are also bad for application latency. Application workers are periodically stopped to service networking traffic. It would be much better to let the application finish its calculations and then service I/O only once it needs more data.

Last but not least NAPI semi-randomly gets kicked out into the ksoftirqd thread which degrades the network latency.

Busy polling

Busy polling is a kernel feature which was originally intended for low latency processing. Whenever an application was out of work it could check if the NIC has any packets to service thus circumventing the interrupt coalescing delay.

Recent work by Bjorn Topel reused the concept to avoid application interruptions altogether. An application can now make a “promise” to the kernel that it will periodically check for new packets itself (kernel sets a timer/alarm to make sure application doesn't break that promise.) The application is expected to use busy polling to process packets, replacing the interrupt driven parts of NAPI.

For example the usual timeline of NAPI processing would look something like:

EVENTS            irq coalescing delay (e.g. 50us)
                  <--->
packet arrival | p  p   ppp   p   pp  p  p  p  pp   p  ppp  p
           IRQ |       X      X        X      X     X     X    
-----------------------------------------------------------------
CPU USE
          NAPI |       NN     NNN      N      N     NN    N
   application |AAAAAAA  AAAAA   AAA AA AAAAAA AAAAA   AA  AAA
                < process req 1    > <process req 2     > <proc..

[Forgive the rough diagram, one space is 10us, assume app needs 150us per req, A is time used by app, N by NAPI.]

With new busy polling we want to achieve this:

EVENTS
packet arrival | p  p   ppp   p   pp  p  p  p  pp   p  ppp  p
           IRQ |
-----------------------------------------------------------
CPU USE
          NAPI |               NNNN                  NNN
   application |AAAAAAAAAAAAAAA^     AAAAAAAAAAAAAAAA^    AA 
                < process req 1>     <process req 2 >     <proc..

Here the application does not get interrupted. Once it's done with a request it asks the kernel to process packets. This allows the app to improve the latency by the amount of time NAPI processing would steal from request processing.

The two caveats of this approach are:

  • application processing has to be on similar granularity as NAPI processing (the typical cycle shouldn't be longer than 200us)
  • the application itself needs to be designed with CPU mapping in mind, or to put it simply the app architecture needs to follow the thread per core design – since NAPI instances are mapped to cores and there needs to be a thread responsible for polling each NAPI

Threaded NAPI

For applications which don't want to take on the polling challenge a new “threaded” NAPI processing option was added (after years of poking from many teams).

Unlike normal NAPI which relies on the built-in softirq processing, threaded NAPI queues have their own threads which always do the processing. Conceptually it's quite similar to the ksoftirq thread, but:

  • it never does processing “in-line” right after hardware IRQ, it always wakes up the thread
  • it only processes NAPI, not work from other subsystems
  • there is a thread per NAPI (NIC queue pair), rather than thread per core

The main advantage of threaded NAPI is that the network processing load is visible to the CPU scheduler, allowing it to make better choices. In tests performed by Google NAPI threads were explicitly pinned to cores but the application threads were not.

TAPI (work in progress)

The main disadvantage of threaded NAPI is that according to my tests it in fact requires explicit CPU allocation, unless the system is relatively idle, otherwise NAPI threads suffer latencies similar to ksoftirq latencies.

The idea behind “TAPI” is to automatically pack and rebalance multiple instances of NAPI to each thread. The hope is that each thread reaches high enough CPU consumption to get a CPU core all to itself from the scheduler. Rather than having 3 threaded NAPI workers at 30% CPU each, TAPI would have one at 90% which services its 3 instances in a round robin fashion. The automatic packing and balancing should therefore remove the need to manually allocate CPU cores to networking. This mode of operation is inspired by Linux workqueues, but with higher locality and latency guarantees.

Unfortunately, due to upstream emergencies after initial promising results the TAPI work has been on hold for the last 2 months.

All modern NICs implement IRQ coalescing (ethtool -c/-C), which delays RX/TX interrupts hoping more frames arrive in the meantime to allow for batch processing. IRQ coalescing trades off latency for system throughput.

It’s commonly believed that the higher the packet rate, the more batching system needs to keep up. At lower rates the batching would be limited, anyway. This leads to the idea of adaptive IRQ coalescing where the NIC itself – or more likely the driver – adjusts the IRQ timeouts based on the recent rate of packet arrivals.

Unfortunately adaptive coalescing is not a panacea, as it often has predefined range of values it chooses from, and it costs extra CPU processing to continuously recalculate and update the rate (especially with modern NICs which often need to talk to firmware to change settings rather than simply writing to device registers).

The summary above – while correct (I hope :)) misses one important point. There are two sets of IRQ coalescing settings, and only one of them has a significant latency impact. NICs (and the Linux kernel ethtool API) have separate settings for RX and TX. While RX processing is more costly, and therefore playing with RX settings feels more significant – RX batching costs latency. For TX processing (or actually TX completion processing) the latency matters much, much less.

With a simple bpftrace command:

bpftrace -e 'tracepoint:napi:napi_poll { @[args->work] = count(); }'

we can check how many RX packets get received on every NAPI poll (that’s to say how many packets get coalesced). On a moderately loaded system the top entries may look something like:

@[4]: 750
@[3]: 2180
@[2]: 15828
@[1]: 233080
@[0]: 298525

where the first number (in square brackets) is the number of packets coalesced, and the second number is a counter of occurrences.

The 0 work done entries (@[0]: 298525) usually mean that the driver received a TX interrupt, and there were no RX packets to process. Drivers will generally clear their TX rings while doing RX processing – so with TX processing being less latency sensitive – in an ideal scenario we’d like to see no TX interrupts at all, but rather have TX processing piggy back on the RX interrupts.

How high can we set the TX coalescing parameters, then? If the workload is mostly using TCP all we really need to ensure is that we don’t run awry of TCP Small Queues (/proc/sys/net/ipv4/tcp_limit_output_bytes) which is the number of bytes TCP stack is willing to queue up to the NIC without getting a TX completion.

For example recent upstream kernels have TSQ of 1MB, so even with a 50GB NIC – delaying TX interrupts for up to 350us should be fine. Obviously we want to give ourselves a safety margin for scheduling delays, timer slack etc. Additionally, according to my experiments the gains of TX coalescing above 200us are perhaps too low for the risk.

Repeating the bpftrace command from above after setting coalescing to 150us / 128 frames:

@[4]: 831
@[3]: 2066
@[2]: 16056
@[0]: 177186
@[1]: 228985

We see far less @[0] occurrences compared to the first run. The gain in system throughput depends on the workload, I’ve seen an increase of 6% on the workload I tested with.

A word of warning – even though upstream reviewers try to make sure drivers behave sanely and return errors for unsupported configurations – there are vendors out there who will silently ignore TX coalescing settings...