Finding a kernel bug triggered by systemd from userspace
As I was working my way toward a mergeable version of generic entry for ARM32, there was an especially nasty bug that I could not for my life iron out: when booting Debian for armhf I just kept running into a boot splat, while everything else worked fine. It would look something like this:
8<--- cut here ---
Unable to handle kernel paging request at virtual address eaffff76 when execute
[eaffff76] *pgd=eae1141e(bad)
Internal error: Oops: 8000000d [#1] SMP ARM
CPU: 0 UID: 997 PID: 304 Comm: sd-resolve Not tainted 6.13.0-rc1+ #22
Hardware name: ARM-Versatile Express
PC is at 0xeaffff76
LR is at __invoke_syscall_ret+0x0/0x18
pc : [<eaffff76>]    lr : [<80100a68>]    psr: a0030013
sp : fbc11f68  ip : fbc11e78  fp : 76539420
r10: 10c5387d  r9 : 841f4ec0  r8 : 80100284
r7 : ffffffff  r6 : 7653941c  r5 : 76cb6000  r4 : 00000000
r3 : 00000000  r2 : 00000000  r1 : 00080003  r0 : ffffff9f
Flags: NzCv  IRQs on  FIQs on  Mode SVC_32  ISA ARM  Segment none
Control: 10c5387d  Table: 8222006a  DAC: 00000051
Register r0 information: non-paged memory
Register r1 information: non-paged memory
Register r2 information: NULL pointer
Register r3 information: NULL pointer
Register r4 information: NULL pointer
Register r5 information: non-paged memory
Register r6 information: non-paged memory
Register r7 information: non-paged memory
Register r8 information: non-slab/vmalloc memory
Register r9 information: slab task_struct start 841f4ec0 pointer offset 0 size 2240
Register r10 information: non-paged memory
Register r11 information: non-paged memory
Register r12 information: 2-page vmalloc region starting at 0xfbc10000 allocated at copy_process+0x150/0xd88
Process sd-resolve (pid: 304, stack limit = 0xbab1c12b)
Stack: (0xfbc11f68 to 0xfbc12000)
1f60:                   00000000 76cb6000 fbc11fb0 ffffffff 80100284 80cdd330
1f80: 80100284 841f4ec0 10c5387d 80111eac 00000000 76cb6000 7653941c 00000119
1fa0: 76539420 80100280 00000000 76cb6000 ffffff9f 00080003 00000000 00000000
1fc0: 00000000 76cb6000 7653941c 00000119 76539c48 76539c44 76539b6c 76539420
1fe0: 76f3a450 765392c4 76c72a4d 76c60108 20030030 00000010 00000000 00000000
Call trace:
Code: 00000000 00000000 00000000 00000000 (00000000)
---[ end trace 0000000000000000 ]---
The paging request means that we are in kernel mode, and we have tried to page in a page that does not exist, such as reading from random uninitialized memory somewhere. If this was userspace, we would get a “segmentation fault”. So this is a pretty common error in C programs.
Notice the following: no call trace. This always happens when you least of all want it: how am I supposed to know how we got here?
But the die() splat has this helpful information: PID: 304 Comm: sd-resolve which reads: this was caused by the process initiated by the command sd-resolve executing as PID 304. But sd-resolve is just something systemd fires temporarily when bringing up some other service, so it must be part of a service. Luckily we also have dmesg:
       Starting systemd-timesyncd… - Network Time Synchronization...
8<--- cut here ---
Unable to handle kernel paging request at virtual address eaffff76 when execute
Aha it's the NTP service. We can verify that this process is causing the mess by issuing:
systemctl restart systemd-timesyncd
And indeed, we get a second reproducable splat. OK great, let's use ftrace to tell us what happened.
The excellent article Secrets of the Ftrace function tracer tells us that it's as simple as echoing the PID of the process into set_ftrace_pid in the kernel debug/tracing sysfs filetree.
There is a problem though: this process is by its very nature transient. I don't know the PID! After some googling it turns out you can ask systemd what PID a certain service is running as:
systemctl show --property MainPID --value systemd-timesyncd
So ... we can echo this into set_ftrace_pid, and then start the trace, but the service is transient, how can I restart the service, obtain the PID, start tracing and wait for the service to finish restarting and then end the trace? No that's a tall order.
After some fooling around with trying to restart the service in one window, then quickly switching to another window and start the trace while the restart is happening, I realized what everyone should already know: never put a person to do a machine's job.
I had to write a script that would restart the service, start the trace, wait for the restart to finish and then stop the trace. It ended up looking like this:
#!/bin/bash
TRACEDIR=/sys/kernel/debug/tracing
SERVICE=systemd-timesyncd
TRACEFILE=/root/trace.dat

echo 0 > ${TRACEDIR}/tracing_on
echo "function" > ${TRACEDIR}/current_tracer
(systemctl restart ${SERVICE})& PID=$!
echo 1 > ${TRACEDIR}/tracing_on
echo "Wait for restart to commence"
wait "${PID}"
echo 0 > ${TRACEDIR}/tracing_on
echo "Restarted "
trace-cmd extract -o ${TRACEFILE}
scp ${TRACEFILE} linus@169.254.1.2:/tmp/trace.dat
This does what we want: turn off the tracing, activate the function tracer, restart the systemd-timesyncd service and capture it's PID, start tracing, wait for the restart to commence, then extract the trace and copy it to the development system. No need to figure out the PID of the forked sd-resolve, just capture everything: this window will be small enough that we can capture all the relevant trace information.
After this I brought up kernelshark to inspect the resulting tracefile trace.dat (right-click open in new tab/window to see the details):
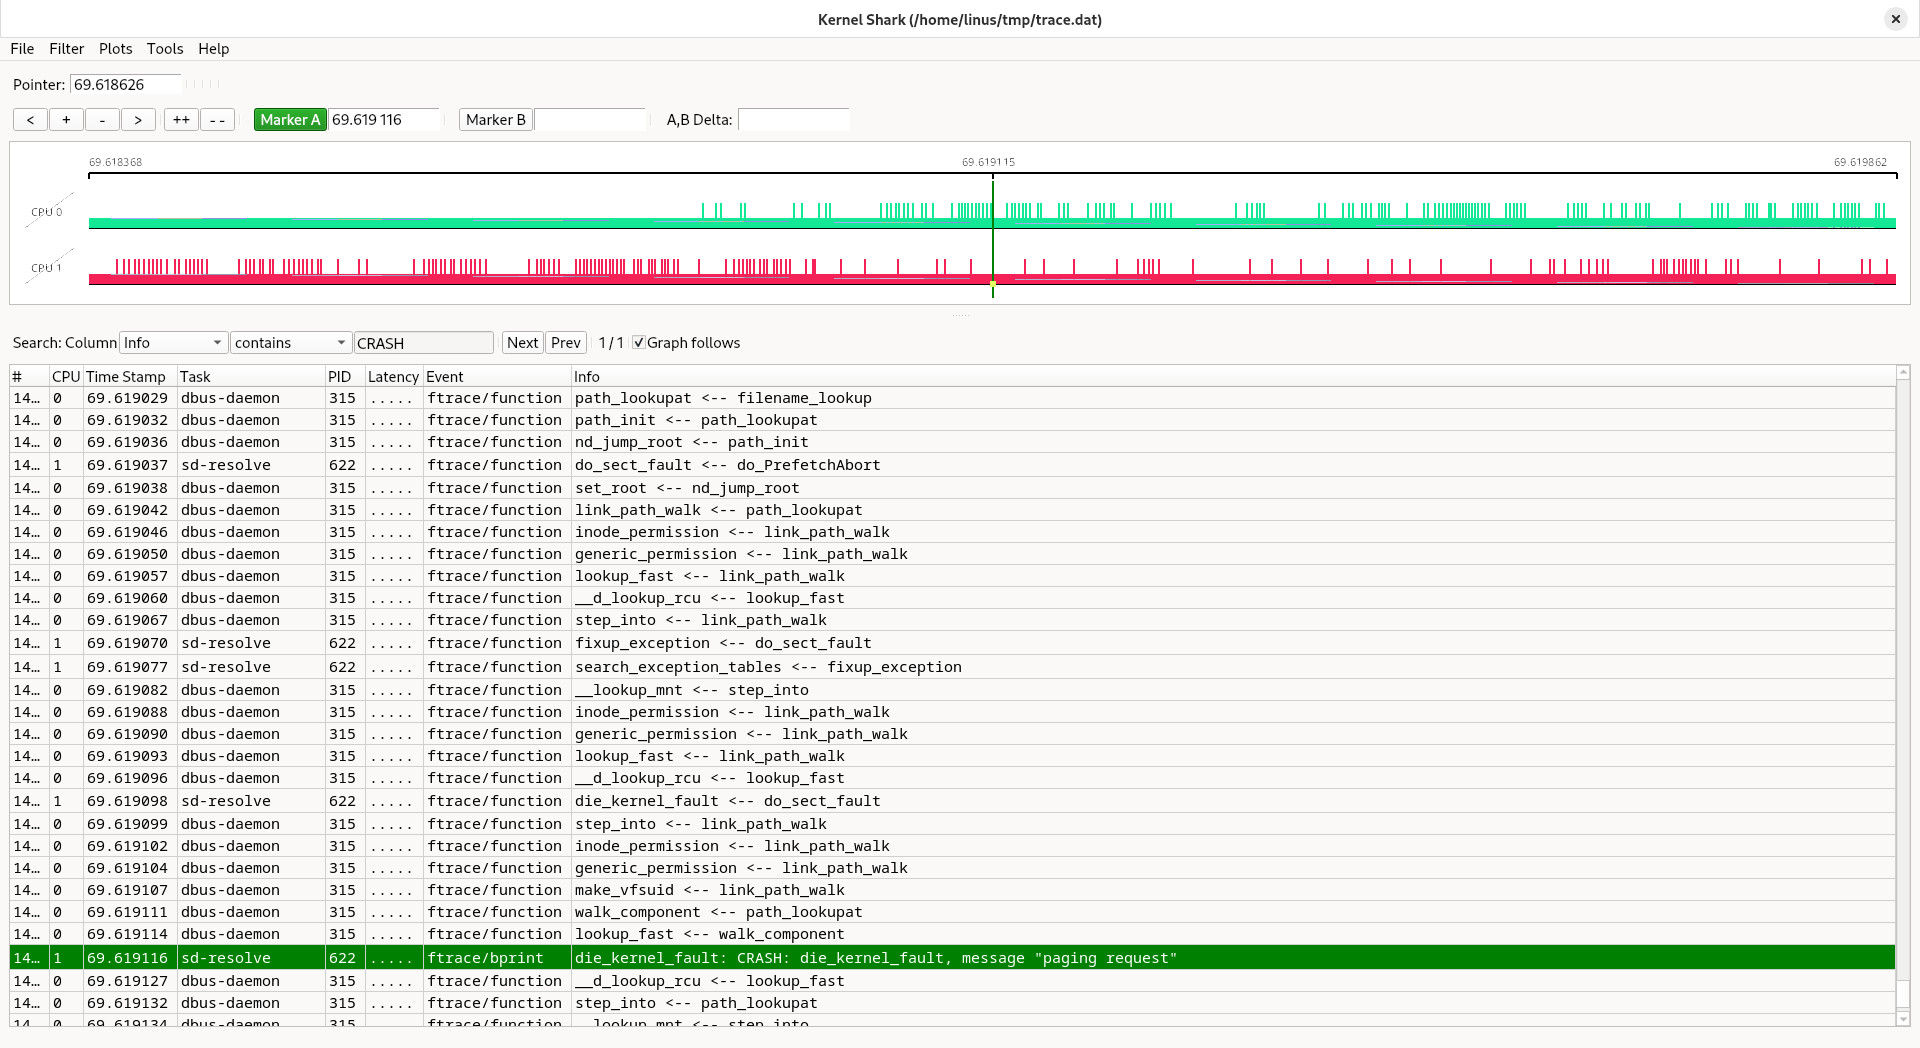
We search for the die() invocation (here I had a pr_info() added with the word “CRASH” as well). Sure enough there it is and the task is indeed sd-resolve. But what happens before? We need to know why we crashed here.
For that we need to re-run the trace but now with the function_graph tracer so we can see the program flow, the indentation helps us to follow the messiness:
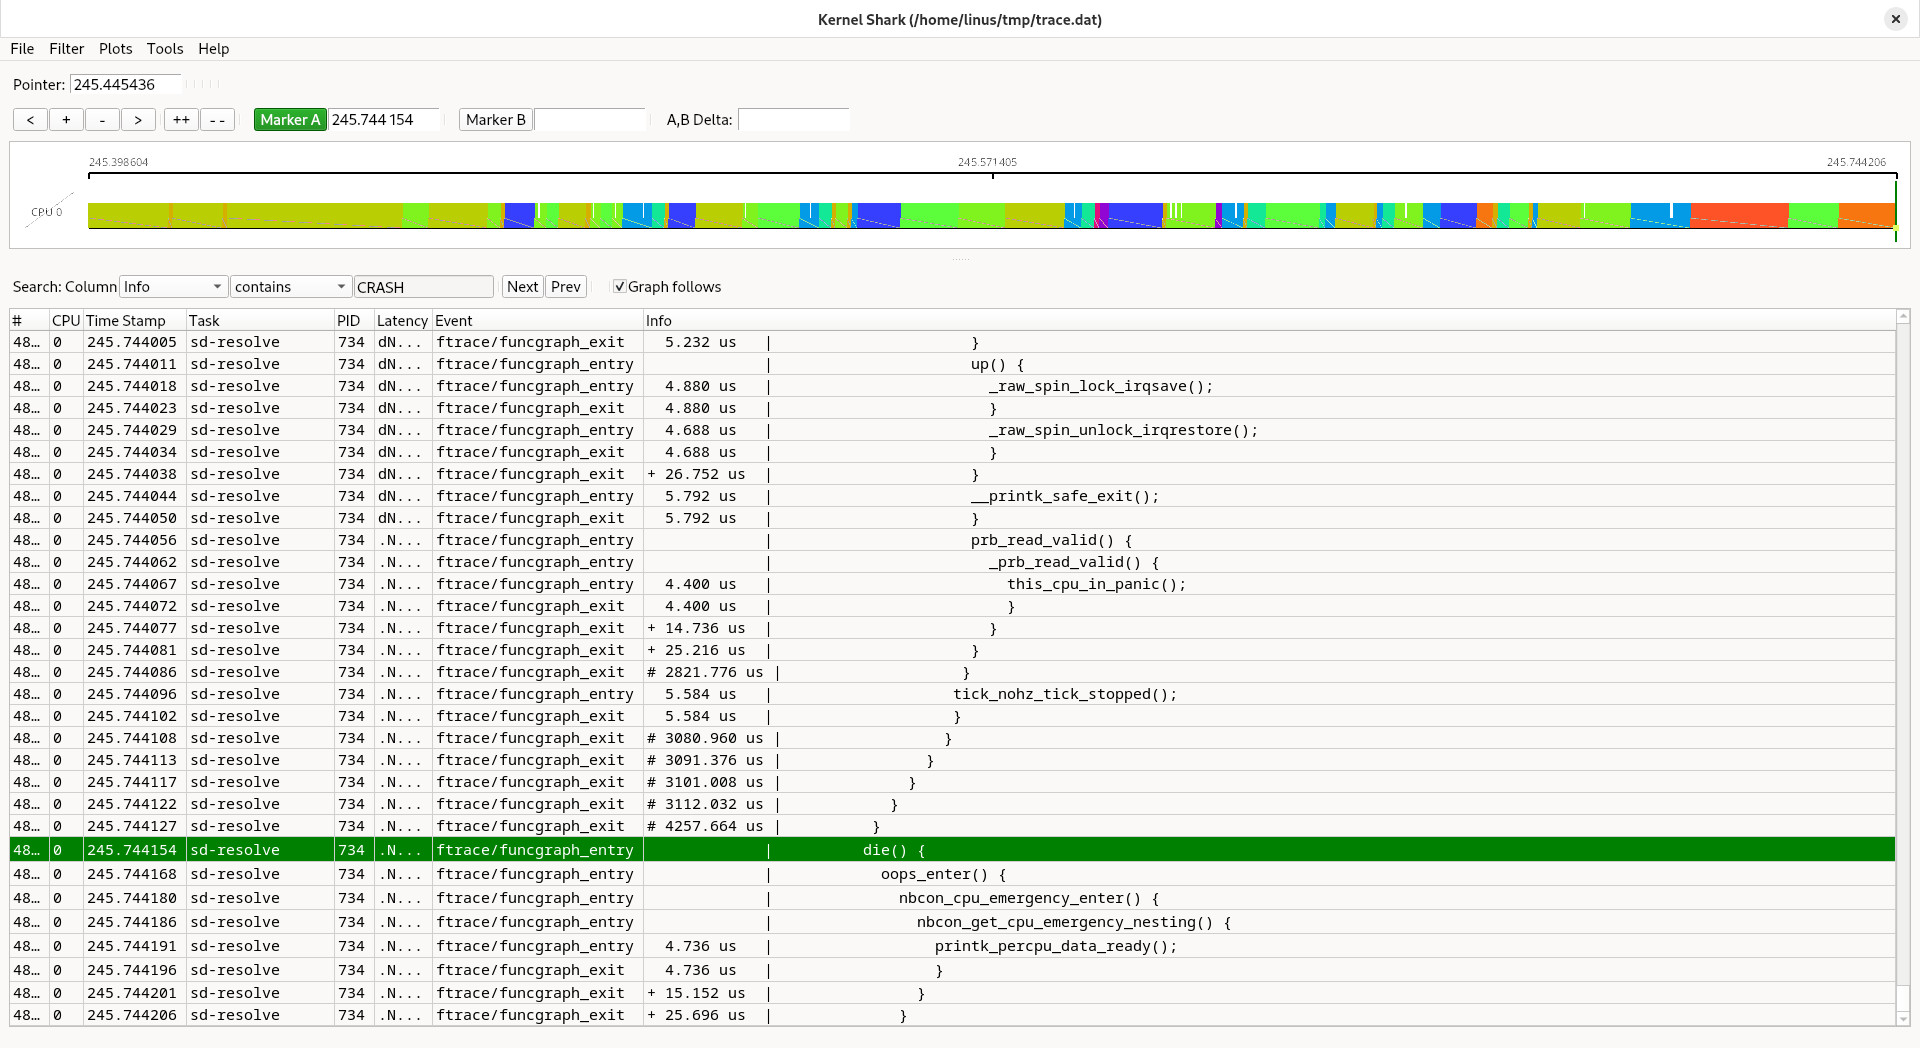
So we switch to the function_graph view and start off from die(), then we just move upward: first we find a prefetch abort, and that is what we already knew: we are getting a page fault, in kernel mode, for a page that does not have a backing storage.
So browse backwards, and:
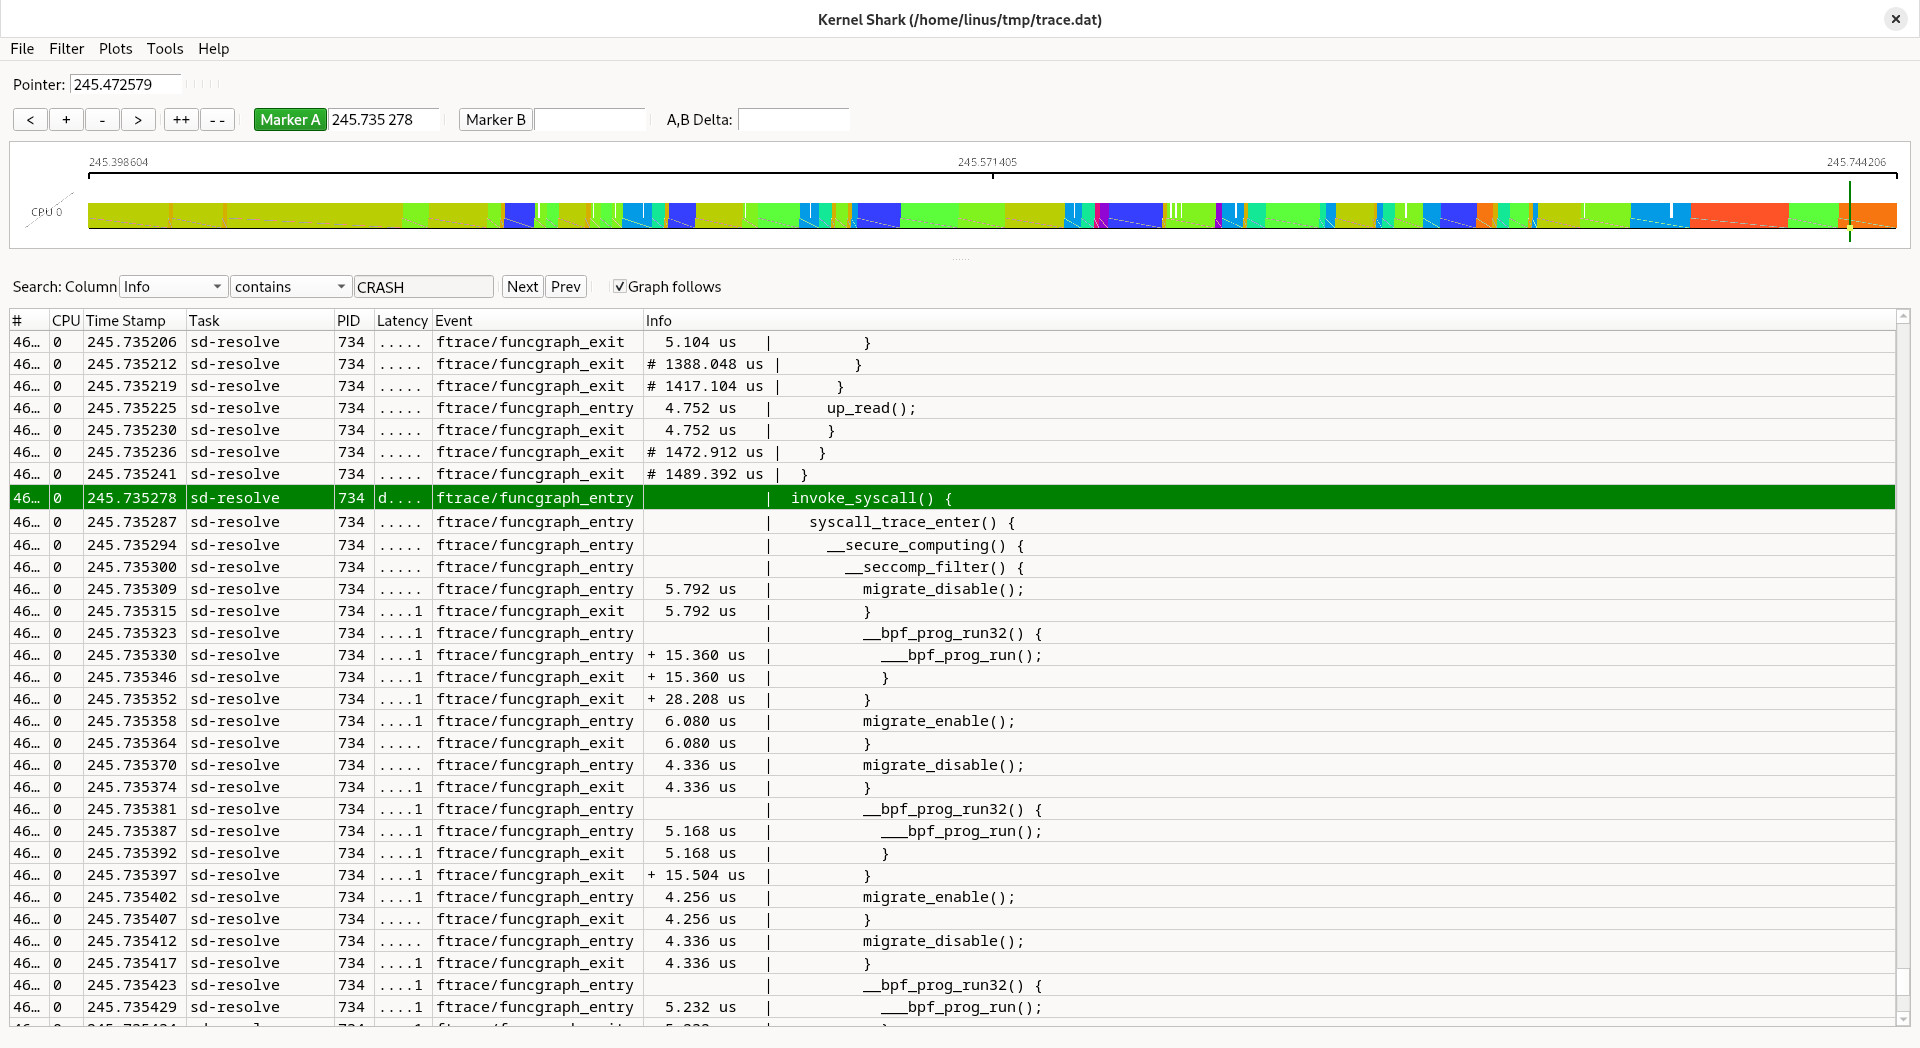
Aha. We are invoking some syscall, and that doesn't really work. So what kind of odd syscall can we invoke that just crash on us like that? We instrument invoke_syscall() to print that out for us, but not for all invocations but just for the task we are interested in, and we know that is sd-resolve:
if (!strcmp(current->comm, "sd-resolve"))
   pr_info("%s invoke syscall %d\n", current->comm, scno);
We take advantage of the fact that the global variable current in the kernel always points to the currently active task. And the field .comm should contain the command name that it was invoked with, such as “sd-resolve”.
Then we run this and oh:
[  OK  ] Started systemd-timesyncd.…0m - Network Time Synchronization.
sd-resolve invoke syscall 291
sd-resolve invoke syscall -1
8<--- cut here ---
Unable to handle kernel paging request at virtual address e7f001f2 when execute
[e7f001f2] *pgd=e7e1141e(bad)
So system call -1 was invoked. This may seem weird to you, but it is actually a legal value: when tracing system calls (such as with strace) the kernel will filter system calls, and the filter will return -1 to indicate that the system call should not even be taken, “skipped”, and my new generic entry code was not taking this properly into account, and the low-level assembly tried to vector -1 into a table and it failed miserably, vectoring us out in the unknown.
At this point I could quickly patch up the code and call it a day.
I have no idea why sd-resolve turns on system call tracing by default, because it obviously does. It could be related to some seccomp security features that are being called in BPF programs prior to every system call in the same code path? I think those need to intercept the system calls anyway. Not particularly efficient, but I suppose quite secure.