David Ahern

Long overdue blog post on XDP; so many details uncovered during testing causing tests to be redone.

This post focuses on a comparison of XDP and OVS in delivering packets to a VM from the perspective of CPU cycles spent by the host in processing those packets. There are a lot of variables at play, and changing any one of them radically affects the outcome, though it should be no surprise XDP is always lighter and faster.

Setup

I believe I am covering all of the settings here that I discovered over the past few months that caused variations in the data.

Host

The host is a standard, modern server (Dell PowerEdge R640) with an Intel® Xeon® Platinum 8168 CPU @ 2.70GHz with 96 hardware threads (48 cores + hyper threading to yield 96 logical cpus in the host). The server is running Ubuntu 18.04 with the recently released 5.8.0 kernel. It has a Mellanox Connectx4-LX ethernet card with 2 25G ports into an 802.3ad (LACP) bond, and the bond is connected to an OVS bridge.

Host setup

As discussed in [1] to properly compare the CPU costs of the 2 networking solutions, we need to consolidate packet processing to a single CPU. Handling all packets destined to the same VM on the same CPU avoids lock contention on the tun ring, so consolidating packets to a single CPU is actually best case performance.

Ensure RPS is disabled in the host:

for d in eth0 eth1; do
    find /sys/class/net/${d}/queues -name rps_cpus |
    while read f; do
            echo 0 | sudo tee ${f}
    done
done

and add flow rules in the NIC to push packets for the VM under test to a single CPU:

sudo ethtool -N eth0 flow-type ether dst 12:34:de:ad:ca:fe action 2
sudo ethtool -N eth1 flow-type ether dst 12:34:de:ad:ca:fe action 2

For this host and ethernet card, packets for queue 2 are handled on CPU 5 (consult /proc/interrupts for the mapping on your host).

XDP bypasses the qdisc layer, so to have a fair comparison make noqueue the default qdisc before starting the VM:

sudo sysctl -w net.core.default_qdisc=noqueue

(or add a udev rule [2]).

Finally, the host is fairly quiet with only one VM running (the one under test) and very little network traffic outside of the VM under test and a few, low traffic ssh sessions used to run commands to collect data about the tests.

Virtual Machine

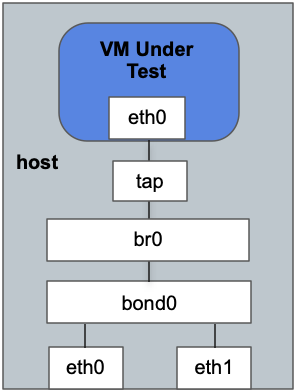
The VM has 8 cpus and is also running Ubuntu 18.04 with a 5.8.0 kernel. It uses tap+vhost for networking with the tap device a port in the OVS bridge as shown in the picture above. The tap device has a single queue, and RPS is also disabled in the guest:

echo 00 | sudo tee /sys/class/net/eth0/queues -name rps_cpus

The VM is also quiet with no load running in the guest OS.

The point of this comparison is host side processing of packets, so packets are dropped in the guest as soon as possible using a bpf program [3] attached to eth0 as a tc filter. (Note: Theoretically, XDP should be used to drop the packets in the guest OS since it truly is the fewest cycles per packet. However, XDP in the VM requires a multi-queue NIC[5], and adding queues to the guest NIC has a huge affect on the results.)

In the host, the qemu threads corresponding to the guest CPUs (vcpus) are affined (as a set) to 8 hardware threads in the same NUMA node as CPU 5 (the host CPU processing packets per the RSS rules mentioned earlier). The vhost thread for the VM's tap device is also affined to a small set of host CPUs in the same NUMA node to avoid scheduling collisions with the vcpu threads, the CPU processing packets (5) and its sibling hardware thread (CPU 53 in my case) – all of which add variability to the results.

Forwarding with XDP

Packet forwarding with XDP is done by attaching an L2 forwarding program [4] to eth0 and eth1. The program pulls the VLAN and destination mac from the ethernet header, and uses the pair as a key for a lookup in a hash map. The lookup returns the next device index for the packet which for packets destined to the VM is the index of its tap device. If an entry is found, the packet is redirected to the device via XDP_REDIRECT. The use case was presented in depth at netdevconf 0x14 [5].

Packet generator

Packets are generated using 2 VMs on a server that is directly connected to the same TOR switches as the hypervisor running the VM under test. The point of the investigation is to measure the overhead of delivering packets to a VM, so memcpy is kept to a minimum by having the packet generator [6] in the VMs send 1-byte UDP packets.

Test setup

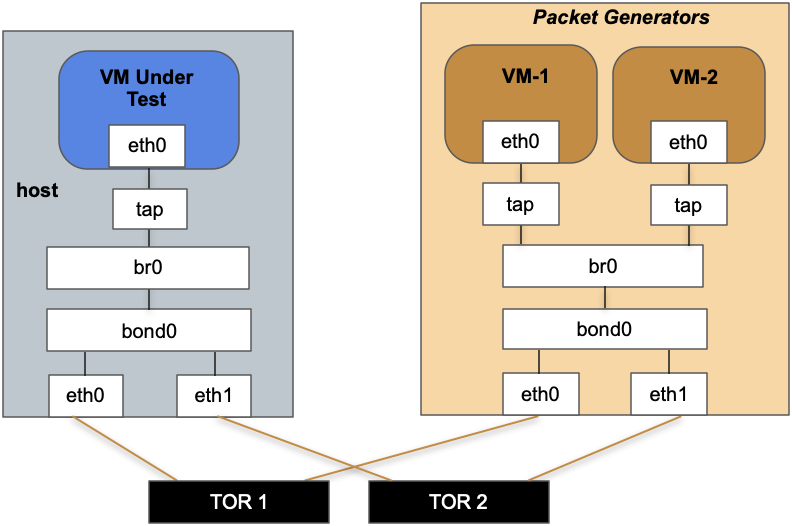
Each VM can generate a little over 1 million packets per sec (1M pps), for a maximum load of 2.2M pps based on 2 separate source addresses.

CPU Measurement

As discussed in [1] a fair number of packets are processed in the context of some interrupted, victim process or when handled on an idle CPU the cycles are not fully accounted in the softirq time shown in tools like mpstat.

This test binds openssl speed, a purely userspace command[1], to the CPU handling packets to fully consume 100% of all CPU cycles which makes the division of CPU time between user, system and softirq more transparent. In this case, the output of mpstat -P 5 shows how all of the cycles for CPU 5 were spent (within the resolution of system accounting): * %softirq is the time spent handling packets. This data is shown in the graphs below. * %usr represents the usable CPU time for processes to make progress on their workload. In this test, it shows the percentage of CPU consumed by openssl and compares to the times shown by openssl within 1-2%. * %sys is the percentage of kernel time and for the data shown below was always <0.2%.

As an example, in this mpstat output openssl is only getting 14.2% of the CPU while 85.8% was spent handling the packet load:

CPU    %usr   %nice    %sys  %iowait   %irq   %soft   %idle
  5   14.20    0.00    0.00     0.00   0.00   85.80   0.00

(%steal, %guest and %gnice dropped were always 0 and dropped for conciseness.)

Let's get to the data.

CPU Comparison

This chart shows a comparison of the %softirq required to handle various PPS rates for both OVS and XDP. Lower numbers are better (higher percentages mean more CPU cycles).

1-VM softirq

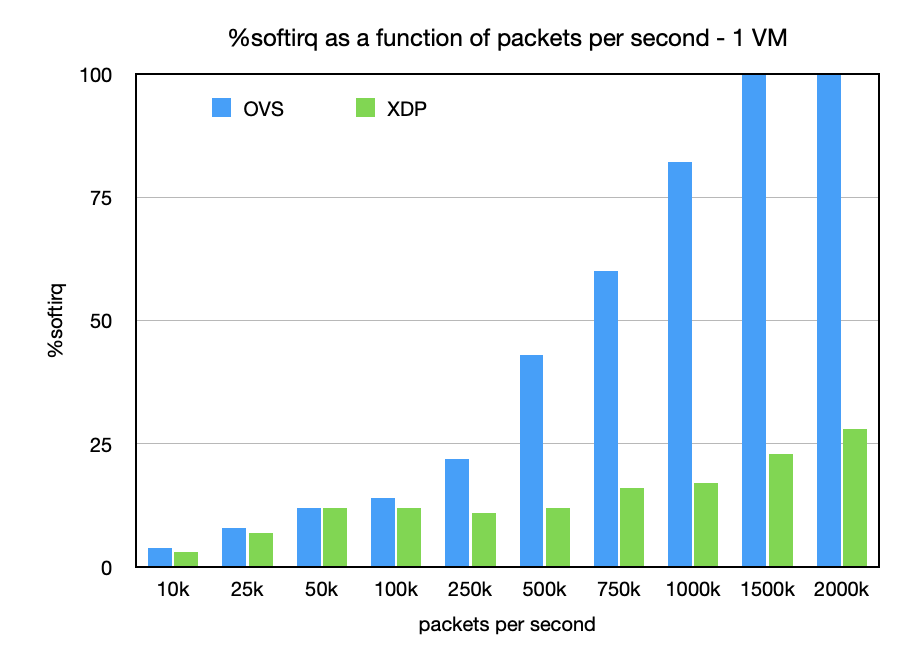
There is 1-2% variability in ksoftirqd percentages despite the 5-second averaging, but the variability does not really affect the important points of this comparison.

The results should not be that surprising. OVS has well established scaling problems and the chart shows that as packet rates increase. In my tests it was not hard to saturate a CPU with OVS, reaching a maximum packet rate to the VM of 1.2M pps. The 100% softirq at 1.5M pps and up is saturation of ksoftirqd alone with nothing else running on that CPU. Running another process on CPU 5 immediately affects the throughput rate as the CPU splits time between processing packets and running that process. With openssl, the packet rate to the VM is cut in half with packet drops at the host ingress as it can no longer keep up with the packet rate given the overhead of OVS.

XDP on the other hand could push 2M pps to the VM before the guest could no longer keep up with packet drops at the tap device (ie., no room in the tun ring meaning the guest has not processed the previous packets). As shown above, the host still has plenty of CPU to handle more packets or run workloads (preferred condition for a cloud host).

One thing to notice about the chart above is the apparent flat lining of CPU usage between 50k pps and 500k pps. That is not a typo, and the results are very repeatable. This needs more investigation, but I believe it shows the efficiencies kicking in from a combination of more packets getting handled per napi poll cycle (closer to maximum of the netdev budget) and the kernel side bulking in XDP before a flush is required.

Hosts typically run more than 1 VM, so let's see the effect of adding a second VM to the mix. For this case a second VM is started with the same setup as mentioned earlier, but now the traffic load is split equally between 2 VMs. The key point here is a single CPU processing interleaved network traffic for 2 different destinations.

2-VM softirq

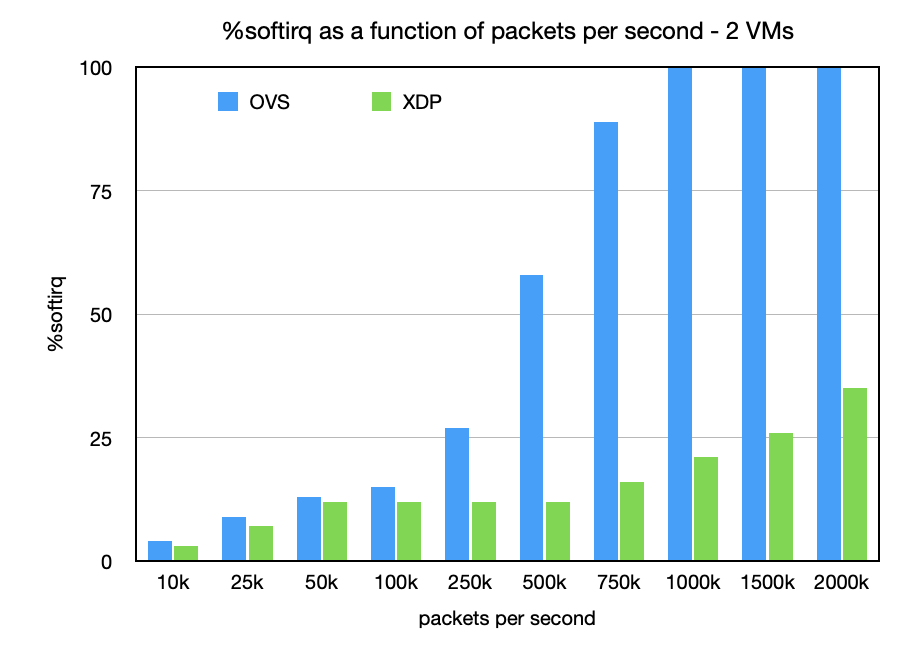
For OVS, CPU saturation with ksoftirqd happens with a maximum packet rate to each VM of 800k pps (compared to 1.2M with only a single VM). The saturation is in the host with packet drops shown at host ingress, and again any competition for the CPU processing packets cuts the rate in half.

Meanwhile, XDP is barely affected by the second VM with a modest increase of 3-4% in softirq at the upper packet rates. In this case, the redirected packets are just hitting separate bulking queues in the kernel. The two packet generators are not able to hit 4+M pps to find the maximum per-VM rate.

Final Thoughts

CPU cycles are only the beginning for comparing network solutions. A full OVS-vs-XDP comparison needs to consider all the resources consumed – e.g., memory as well as CPU. For example, OVS has ovs-vswitchd which consumes a high amount of memory (>750MB RSS on this server with only the 2 VMs) and additional CPU cycles to handle upcalls (flow misses) and revalidate flow entries in the kernel which on an active hypervisor can easily consume 50+% cpu (not counting increased usage from various bugs[7]).

Meanwhile, XDP is still early in its lifecycle. Right now, using XDP for this setup requires VLAN acceleration in the NIC [5] to be disabled meaning the VLAN header has to be removed by the ebpf program before forwarding to the VM. Using the proposed hardware hints solution reduces the softirq time by another 1-2% meaning 1-2% more usable CPU by leveraging hardware acceleration with XDP. This is just an example of how XDP will continue to get faster as it works better with hardware offloads.

Acronyms

LACP Link Aggregation Control Protocol NIC Nework Interface Card NUMA Non-Uniform Memory Access OVS Open VSwitch PPS Packets per Second RPS Receive Packet Steering RSS Receive Side Scaling TOR Top-of-Rack VM Virtual Machine XDP Express Data Path in Linux

References

[1] https://people.kernel.org/dsahern/the-cpu-cost-of-networking-on-a-host [2] https://people.kernel.org/dsahern/rss-rps-locking-qdisc [3] https://github.com/dsahern/bpf-progs/blob/master/ksrc/rx_acl.c [4] https://github.com/dsahern/bpf-progs/blob/master/ksrc/xdp_l2fwd.c [5] https://netdevconf.info/0x14/session.html?tutorial-XDP-and-the-cloud [6] https://github.com/dsahern/random-cmds/blob/master/src/pktgen.c [7] https://www.mail-archive.com/ovs-dev@openvswitch.org/msg39266.html

I recently learned this fun fact: With RSS or RPS enabled [1] and a lock-based qdisc on a VM's tap device (e.g., fq_codel) a UDP packet storm targeted at the VM can severely impact the entire server.

The point of RSS/RPS is to distribute the packet processing load across all hardware threads (CPUs) in a server / host. However, when those packets are forwarded to a single device that has a lock-based qdisc (e.g., virtual machines and a tap device or a container and veth based device) that distributed processing causes heavy spinlock contention resulting in ksoftirqd spinning on all CPUs trying to handle the packet load.

As an example, my server has 96 cpus and 1 million udp packets per second targeted at the VM is enough to push all of the ksoftirqd threads to near 100%:

  PID %CPU COMMAND               P
   58 99.9 ksoftirqd/9           9
  128 99.9 ksoftirqd/23         23
  218 99.9 ksoftirqd/41         41
  278 99.9 ksoftirqd/53         53
  318 99.9 ksoftirqd/61         61
  328 99.9 ksoftirqd/63         63
  358 99.9 ksoftirqd/69         69
  388 99.9 ksoftirqd/75         75
  408 99.9 ksoftirqd/79         79
  438 99.9 ksoftirqd/85         85
 7411 99.9 CPU 7/KVM            64
   28 99.9 ksoftirqd/3           3
   38 99.9 ksoftirqd/5           5
   48 99.9 ksoftirqd/7           7
   68 99.9 ksoftirqd/11         11
   78 99.9 ksoftirqd/13         13
   88 99.9 ksoftirqd/15         15
   ...

perf top shows the spinlock contention:

    96.79%  [kernel]          [k] queued_spin_lock_slowpath
     0.40%  [kernel]          [k] _raw_spin_lock
     0.23%  [kernel]          [k] __netif_receive_skb_core
     0.23%  [kernel]          [k] __dev_queue_xmit
     0.20%  [kernel]          [k] __qdisc_run

With the callchain leading to

    94.25%  [kernel.vmlinux]    [k] queued_spin_lock_slowpath
            |
             --94.25%--queued_spin_lock_slowpath
                       |
                        --93.83%--__dev_queue_xmit
                                  do_execute_actions
                                  ovs_execute_actions
                                  ovs_dp_process_packet
                                  ovs_vport_receive

A little code analysis shows this is the qdisc lock in __dev_xmit_skb.

The overloaded ksoftirqd threads means it takes longer to process packets resulting in budget limits getting hit and packet drops at ingress. The packet drops can cause ssh sessions to stall or drop or cause disruptions in protocols like LACP.

Changing the qdisc on the device to a lockless one (e.g., noqueue) dramatically lowers the ksoftirqd load. perf top still shows the hot spot as a spinlock:

    25.62%  [kernel]          [k] queued_spin_lock_slowpath
     6.87%  [kernel]          [k] tasklet_action_common.isra.21
     3.28%  [kernel]          [k] _raw_spin_lock
     3.15%  [kernel]          [k] tun_net_xmit

but this time it is the lock for the tun ring:

    25.10%  [kernel.vmlinux]    [k] queued_spin_lock_slowpath
            |
             --25.05%--queued_spin_lock_slowpath
                       |
                        --24.93%--tun_net_xmit
                                  dev_hard_start_xmit
                                  __dev_queue_xmit
                                  do_execute_actions
                                  ovs_execute_actions
                                  ovs_dp_process_packet
                                  ovs_vport_receive

which is a much lighter lock in the sense of the amount of work done with the lock held.

systemd commit e6c253e363dee, released in systemd 217, changed the default qdisc from pfifo_fast (kernel default) to fq_codel (/usr/lib/sysctl.d/50-default.conf for Ubuntu). As of v5.8 kernel fq_codel still has a lock to enqueue packets, so systems using fq_codel with RSS/RPS are hitting this lock contention which affects overall system performance. pfifo_fast is lockless as of v4.16 so for newer kernels the kernel's default is best.

But, it begs the question why have a qdisc for a VM tap device (or a container's veth device) at all? To the VM a host is just part of the network. You would not want a top-of-rack switch to buffer packets for the server, so why have the host buffer packets for a VM? (The “Tx” path for a tap device represents packets going to the VM.)

You can change the default via:

sysctl -w net.core.default_qdisc=noqueue

or add that to a sysctl file (e.g., /etc/sysctl.d/90-local.conf). sysctl changes affect new devices only.

Alternatively, the default can be changed for selected devices via a udev rule:

cat > /etc/udev/rules.d/90-tap.rules <<EOF
ACTION=="add|change", SUBSYSTEM=="net", KERNEL=="tap*", PROGRAM="/sbin/tc qdisc add dev $env{INTERFACE} root handle 1000: noqueue"

Running sudo udevadm trigger should update existing devices. Check using tc qdisc sh dev <NAME>:

$ tc qdisc sh dev tapext4798884
qdisc noqueue 1000: root refcnt 2
qdisc ingress ffff: parent ffff:fff1 ----------------

[1] https://www.kernel.org/doc/Documentation/networking/scaling.txt

When evaluating networking for a host the focus is typically on latency, throughput or packets per second (pps) to see the maximum load a system can handle for a given configuration. While those are important and often telling metrics, results for such benchmarks do not tell you the impact processing those packets has on the workloads running on that system.

This post looks at the cost of networking in terms of CPU cycles stolen from processes running in a host.

Packet Processing in Linux

Linux will process a fair amount of packets in the context of whatever is running on the CPU at the moment the irq is handled. System accounting will attribute those CPU cycles to any process running at that moment even though that process is not doing any work on its behalf. For example, 'top' can show a process appears to be using 99+% cpu but in reality 60% of that time is spent processing packets meaning the process is really only get 40% of the CPU to make progress on its workload.

net_rx_action, the handler for network Rx traffic, usually runs really fast – like under 25 usecs[1] – dealing with up to 64 packets per napi instance (NIC and RPS) at a time before deferring to another softirq cycle. softirq cycles can be back to back, up to 10 times or 2 msec (see __do_softirq), before taking a break. If the softirq vector still has more work to do after the maximum number of loops or time is reached, it defers further work to the ksoftirqd thread for that CPU. When that happens the system is a bit more transparent about the networking overhead in the sense that CPU usage can be monitored (though with the assumption that it is packet handling versus other softirqs).

One way to see the above description is using perf:

sudo perf record -a \
        -e irq:irq_handler_entry,irq:irq_handler_exit \
        -e irq:softirq_entry --filter="vec == 3" \
        -e irq:softirq_exit --filter="vec == 3"  \
        -e napi:napi_poll \
        -- sleep 1

sudo perf script

The output is something like:

swapper     0 [005] 176146.491879: irq:irq_handler_entry: irq=152 name=mlx5_comp2@pci:0000:d8:00.0
swapper     0 [005] 176146.491880:  irq:irq_handler_exit: irq=152 ret=handled
swapper     0 [005] 176146.491880:     irq:softirq_entry: vec=3 [action=NET_RX]
swapper     0 [005] 176146.491942:        napi:napi_poll: napi poll on napi struct 0xffff9d3d53863e88 for device eth0 work 64 budget 64
swapper     0 [005] 176146.491943:      irq:softirq_exit: vec=3 [action=NET_RX]
swapper     0 [005] 176146.491943:     irq:softirq_entry: vec=3 [action=NET_RX]
swapper     0 [005] 176146.491971:        napi:napi_poll: napi poll on napi struct 0xffff9d3d53863e88 for device eth0 work 27 budget 64
swapper     0 [005] 176146.491971:      irq:softirq_exit: vec=3 [action=NET_RX]
swapper     0 [005] 176146.492200: irq:irq_handler_entry: irq=152 name=mlx5_comp2@pci:0000:d8:00.0

In this case the cpu is idle (hence swapper for the process), an irq fired for an Rx queue on CPU 5, softirq processing looped twice handling 64 packets and then 27 packets before exiting with the next irq firing 229 usec later and starting the loop again.

The above was recorded on an idle system. In general, any task can be running on the CPU in which case the above series of events plays out by interrupting that task, doing the irq/softirq dance and with system accounting attributing cycles to the interrupted process. Thus, processing packets is typically hidden from the usual CPU monitoring as it is done in the context of some random, victim process, so how do you view or quantify the time a process is interrupted handling packets? And how can you compare 2 different networking solutions to see which one is less disruptive to a workload?

With RSS, RPS, and flow steering, packet processing is usually distributed across cores, so the packet processing sequence describe above is all per-CPU. As packet rates increase (think 100,000 pps and up) the load means 1000's to 10,000's of packets are processed per second per cpu. Processing that many packets will inevitably have an impact on the workloads running on those systems.

Let's take a look at one way to see this impact.

Undo the Distributed Processing

First, let's undo the distributed processing by disabling RPS and installing flow rules to force the processing of all packets for a specific MAC address on a single, known CPU. My system has 2 nics enslaved to a bond in an 802.3ad configuration with the networking load targeted at a single virtual machine running in the host.

RPS is disabled on the 2 nics using

for d in eth0 eth1; do
    find /sys/class/net/${d}/queues -name rps_cpus |
    while read f; do
            echo 0 | sudo tee ${f}
    done
done

Next, add flow rules to push packets for the VM under test to a single CPU

DMAC=12:34:de:ad:ca:fe
sudo ethtool -N eth0 flow-type ether dst ${DMAC} action 2
sudo ethtool -N eth1 flow-type ether dst ${DMAC} action 2

Together, lack of RPS + flow rules ensure all packets destined to the VM are processed on the same CPU. You can use a command like ethq[3] to verify packets are directed to the expected queue and then map that queue to a CPU using /proc/interrupts. In my case queue 2 is handled on CPU 5.

openssl speed

I could use perf or a bpf program to track softirq entry and exit for network Rx, but that gets complicated quick, and the observation will definitely influence the results. A much simpler and more intuitive solution is to infer the networking overhead using a well known workload such as 'openssl speed' and look at how much CPU access it really gets versus is perceived to get (recognizing the squishiness of process accounting).

'openssl speed' is a nearly 100% userspace command and when pinned to a CPU will use all available cycles for that CPU for the duration of its tests. The command works by setting an alarm for a given interval (e.g., 10 seconds here for easy math), launches into its benchmark and then uses times() when the alarm fires as a way of checking how much CPU time it was actually given. From a syscall perspective it looks like this:

alarm(10)                               = 0
times({tms_utime=0, tms_stime=0, tms_cutime=0, tms_cstime=0}) = 1726601344
--- SIGALRM {si_signo=SIGALRM, si_code=SI_KERNEL} ---
rt_sigaction(SIGALRM, ...) = 0
rt_sigreturn({mask=[]}) = 2782545353
times({tms_utime=1000, tms_stime=0, tms_cutime=0, tms_cstime=0}) = 1726602344

so very few system calls between the alarm and checking the results of times(). With no/few interruptions the tms_utime will match the test time (10 seconds in this case).

Since it is is a pure userspace benchmark ANY system time that shows up in times() is overhead. openssl may be the process on the CPU, but the CPU is actually doing something else, like processing packets. For example:

alarm(10)                               = 0
times({tms_utime=0, tms_stime=0, tms_cutime=0, tms_cstime=0}) = 1726617896
--- SIGALRM {si_signo=SIGALRM, si_code=SI_KERNEL} ---
rt_sigaction(SIGALRM, ...) = 0
rt_sigreturn({mask=[]}) = 4079301579
times({tms_utime=178, tms_stime=571, tms_cutime=0, tms_cstime=0}) = 1726618896

shows that openssl was on the cpu for 7.49 seconds (178 + 571 in .01 increments), but 5.71 seconds of that time was in system time. Since openssl is not doing anything in the kernel, that 5.71 seconds is all overhead – time stolen from this process for “system needs.”

Using openssl to Infer Networking Overhead

With an understanding of how 'openssl speed' works, let's look at a near idle server:

$ taskset -c 5 openssl speed -seconds 10 aes-256-cbc >/dev/null
Doing aes-256 cbc for 10s on 16 size blocks: 66675623 aes-256 cbc's in 9.99s
Doing aes-256 cbc for 10s on 64 size blocks: 18096647 aes-256 cbc's in 10.00s
Doing aes-256 cbc for 10s on 256 size blocks: 4607752 aes-256 cbc's in 10.00s
Doing aes-256 cbc for 10s on 1024 size blocks: 1162429 aes-256 cbc's in 10.00s
Doing aes-256 cbc for 10s on 8192 size blocks: 145251 aes-256 cbc's in 10.00s
Doing aes-256 cbc for 10s on 16384 size blocks: 72831 aes-256 cbc's in 10.00s

so in this case openssl reports 9.99 to 10.00 seconds of run time for each of the block sizes confirming no contention for the CPU. Let's add network load, netperf TCP_STREAM from 2 sources, and re-do the test:

$ taskset -c 5 openssl speed -seconds 10 aes-256-cbc >/dev/null
Doing aes-256 cbc for 10s on 16 size blocks: 12061658 aes-256 cbc's in 1.96s
Doing aes-256 cbc for 10s on 64 size blocks: 3457491 aes-256 cbc's in 2.10s
Doing aes-256 cbc for 10s on 256 size blocks: 893939 aes-256 cbc's in 2.01s
Doing aes-256 cbc for 10s on 1024 size blocks: 201756 aes-256 cbc's in 1.86s
Doing aes-256 cbc for 10s on 8192 size blocks: 25117 aes-256 cbc's in 1.78s
Doing aes-256 cbc for 10s on 16384 size blocks: 13859 aes-256 cbc's in 1.89s

Much different outcome. Each block size test wants to run for 10 seconds, but times() is reporting the actual user time to be between 1.78 and 2.10 seconds. Thus, the other 7.9 to 8.22 seconds was spent processing packets – either in the context of openssl or via ksoftirqd.

Looking at top for the previous openssl run:

 PID USER      PR  NI    VIRT    RES    SHR S  %CPU %MEM     TIME+ COMMAND              P 
 8180 libvirt+  20   0 33.269g 1.649g 1.565g S 279.9  0.9  18:57.81 qemu-system-x86     75
 8374 root      20   0       0      0      0 R  99.4  0.0   2:57.97 vhost-8180          89
 1684 dahern    20   0   17112   4400   3892 R  73.6  0.0   0:09.91 openssl              5    
   38 root      20   0       0      0      0 R  26.2  0.0   0:31.86 ksoftirqd/5          5

one would think openssl is using ~73% of cpu 5 with ksoftirqd taking the rest but in reality so many packets are getting processed in the context of openssl that it is only effectively getting 18-21% time on the cpu to make progress on its workload.

If I drop the network load to just 1 stream, openssl appears to be running at 99% CPU:

  PID USER      PR  NI    VIRT    RES    SHR S  %CPU %MEM     TIME+ COMMAND              P
 8180 libvirt+  20   0 33.269g 1.722g 1.637g S 325.1  0.9 166:38.12 qemu-system-x86     29
44218 dahern    20   0   17112   4488   3996 R  99.2  0.0   0:28.55 openssl              5
 8374 root      20   0       0      0      0 R  64.7  0.0  60:40.50 vhost-8180          55
   38 root      20   0       0      0      0 S   1.0  0.0   4:51.98 ksoftirqd/5          5

but openssl reports ~4 seconds of userspace time:

Doing aes-256 cbc for 10s on 16 size blocks: 26596388 aes-256 cbc's in 4.01s
Doing aes-256 cbc for 10s on 64 size blocks: 7137481 aes-256 cbc's in 4.14s
Doing aes-256 cbc for 10s on 256 size blocks: 1844565 aes-256 cbc's in 4.31s
Doing aes-256 cbc for 10s on 1024 size blocks: 472687 aes-256 cbc's in 4.28s
Doing aes-256 cbc for 10s on 8192 size blocks: 59001 aes-256 cbc's in 4.46s
Doing aes-256 cbc for 10s on 16384 size blocks: 28569 aes-256 cbc's in 4.16s

Again, monitoring tools show a lot of CPU access, but reality is much different with 55-80% of the CPU spent processing packets. The throughput numbers look great (22+Gbps for a 25G link), but the impact on processes is huge.

In this example, the process robbed of CPU cycles is a silly benchmark. On a fully populated host the interrupted process can be anything – virtual cpus for a VM, emulator threads for the VM, vhost threads for the VM, or host level system processes with varying degrees of impact on performance of those processes and the system.

Up Next

This post is the basis for a follow up post where I will discuss a comparison of the overhead of “full stack” on a VM host to “XDP”.

[1] Measured using ebpf program on entry and exit. See net_rx_action in https://github.com/dsahern/bpf-progs

[2] Assuming no bugs in the networking stack and driver. I have examined systems where net_rx_action takes well over 20,000 usec to process less than 64 packets due to a combination of bugs in the NIC driver (ARFS path) and OVS (thundering herd wakeup).

[3] https://github.com/isc-projects/ethq

Running docker service over management VRF requires the service to be started bound to the VRF. Since docker and systemd do not natively understand VRF, the vrf exec helper in iproute2 can be used.

This series of steps worked for me on Ubuntu 19.10 and should work on 18.04 as well:

  • Configure mgmt VRF and disable systemd-resolved as noted in a previous post about management vrf and DNS

  • Install docker-ce

  • Edit /lib/systemd/system/docker.service and add /usr/sbin/ip vrf exec mgmt to the Exec lines like this:

    ExecStart=/usr/sbin/ip vrf exec mgmt /usr/bin/dockerd -H fd://
    --containerd=/run/containerd/containerd.sock
    
  • Tell systemd about the change and restart docker

    systemctl daemon-reload
    systemctl restart docker
    

With that, docker pull should work fine – in mgmt vrf or default vrf.

Someone recently asked me why apt-get was not working when he enabled management VRF on Ubuntu 18.04. After a few back and forths and a little digging I was reminded of why. The TL;DR is systemd-resolved. This blog post documents how I came to that conclusion and what you need to do to use management VRF with Ubuntu (or any OS using a DNS caching service such as systemd-resolved).

The following example is based on a newly created Ubuntu 18.04 VM. The VM comes up with the 4.15.0-66-generic kernel which is missing the VRF module:

$ modprobe vrf
modprobe: FATAL: Module vrf not found in directory /lib/modules/4.15.0-66-generic

despite VRF being enabled and built:

$ grep VRF /boot/config-4.15.0-66-generic
CONFIG_NET_VRF=m

which is really weird.[4] So for this blog post I shifted to the v5.3 HWE kernel: $ sudo apt-get install --install-recommends linux-generic-hwe-18.04

although nothing about the DNS problem is kernel specific. A 4.14 or better kernel with VRF enabled and usable will work.

First, let's enable Management VRF. All of the following commands need to be run as root. For simplicity getting started, you will want to enable this sysctl to allow sshd to work across VRFs:

    echo "net.ipv4.tcp_l3mdev_accept=1" >> /etc/sysctl.d/99-sysctl.conf
    sysctl -p /etc/sysctl.d/99-sysctl.conf

Advanced users can leave that disabled and use something like the systemd instances to run sshd in Management VRF only.[1]

Ubuntu has moved to netplan for network configuration, and apparently netplan is still missing VRF support despite requests from multiple users since May 2018: https://bugs.launchpad.net/netplan/+bug/1773522

One option to workaround the problem is to put the following in /etc/networkd-dispatcher/routable.d/50-ifup-hooks:

#!/bin/bash

ip link show dev mgmt 2>/dev/null
if [ $? -ne 0 ]
then
        # capture default route
        DEF=$(ip ro ls default)

        # only need to do this once
        ip link add mgmt type vrf table 1000
        ip link set mgmt up
        ip link set eth0 vrf mgmt
        sleep 1

        # move the default route
        ip route add vrf mgmt ${DEF}
        ip route del default

        # fix up rules to look in VRF table first
        ip ru add pref 32765 from all lookup local
        ip ru del pref 0
        ip -6 ru add pref 32765 from all lookup local
        ip -6 ru del pref 0
fi
ip route del default

The above assumes eth0 is the nic to put into Management VRF, and it has a static IP address. If using DHCP instead of a static route, create or update the dhclient-exit-hook to put the default route in the Management VRF table.[3] Another option is to use ifupdown2 for network management; it has good support for VRF.[1]

Reboot node to make the changes take effect.

WARNING: If you run these commands from an active ssh session, you will lose connectivity since you are shifting the L3 domain of eth0 and that impacts existing logins. You can avoid the reboot by running the above commands from console.

After logging back in to the node with Management VRF enabled, the first thing to remember is that when VRF is enabled network addresses become relative to the VRF – and that includes loopback addresses (they are not that special).

Any command that needs to contact a service over the Management VRF needs to be run in that context. If the command does not have native VRF support, then you can use 'ip vrf exec' as a helper to do the VRF binding. 'ip vrf exec' uses a small eBPF program to bind all IPv4 and IPv6 sockets opened by the command to the given device ('mgmt' in this case) which causes all routing lookups to go to the table associated with the VRF (table 1000 per the setting above).

Let's see what happens:

$ ip vrf exec mgmt apt-get update
Err:1 http://mirrors.digitalocean.com/ubuntu bionic InRelease
  Temporary failure resolving 'mirrors.digitalocean.com'
Err:2 http://security.ubuntu.com/ubuntu bionic-security InRelease
  Temporary failure resolving 'security.ubuntu.com'
Err:3 http://mirrors.digitalocean.com/ubuntu bionic-updates InRelease
  Temporary failure resolving 'mirrors.digitalocean.com'
Err:4 http://mirrors.digitalocean.com/ubuntu bionic-backports InRelease
  Temporary failure resolving 'mirrors.digitalocean.com'

Theoretically, this should Just Work, but it clearly does not. Why?

Ubuntu uses systemd-resolved service by default with /etc/resolv.conf configured to send DNS lookups to it:

$ ls -l /etc/resolv.conf
lrwxrwxrwx 1 root root 39 Oct 21 15:48 /etc/resolv.conf -> ../run/systemd/resolve/stub-resolv.conf

$ cat /etc/resolv.conf
...
nameserver 127.0.0.53
options edns0

So when a process (e.g., apt) does a name lookup, the message is sent to 127.0.0.53/53. In theory, systemd-resolved gets the request and attempts to contact the actual nameserver.

Where does the theory breakdown? In 3 places.

First, 127.0.0.53 is not configured for Management VRF, so attempts to reach it fail:

$ ip ro get vrf mgmt 127.0.0.53
127.0.0.53 via 157.245.160.1 dev eth0 table 1000 src 157.245.160.132 uid 0
    cache

That one is easy enough to fix. The VRF device is meant to be the loopback for a VRF, so let's add the loopback addresses to it:

    $ ip addr add dev mgmt 127.0.0.1/8
    $ ip addr add dev mgmt ::1/128

    $ ip ro get vrf mgmt 127.0.0.53
    127.0.0.53 dev mgmt table 1000 src 127.0.0.1 uid 0
        cache

The second problem is systemd-resolved binds its socket to the loopback device:

    $ ss -apn | grep systemd-resolve
    udp  UNCONN   0      0       127.0.0.53%lo:53     0.0.0.0:*     users:(("systemd-resolve",pid=803,fd=12))
    tcp  LISTEN   0      128     127.0.0.53%lo:53     0.0.0.0:*     users:(("systemd-resolve",pid=803,fd=13))

The loopback device is in the default VRF and can not be moved to Management VRF. A process bound to the Management VRF can not communicate with a socket bound to the loopback device.

The third issue is that systemd-resolved runs in the default VRF, so its attempts to reach the real DNS server happen over the default VRF. Those attempts fail since the servers are only reachable from the Management VRF and systemd-resolved has no knowledge of it.

Since systemd-resolved is hardcoded (from a quick look at the source) to bind to the loopback device, there is no option but to disable it. It is not compatible with Management VRF – or VRF at all.

$ rm /etc/resolv.conf
$ grep nameserver /run/systemd/resolve/resolv.conf > /etc/resolv.conf
$ systemctl stop systemd-resolved.service
$ systemctl disable systemd-resolved.service

With that it works as expected:
$ ip vrf exec mgmt apt-get update
Get:1 http://mirrors.digitalocean.com/ubuntu bionic InRelease [242 kB]
Get:2 http://mirrors.digitalocean.com/ubuntu bionic-updates InRelease [88.7 kB]
Get:3 http://mirrors.digitalocean.com/ubuntu bionic-backports InRelease [74.6 kB]
Get:4 http://security.ubuntu.com/ubuntu bionic-security InRelease [88.7 kB]
Get:5 http://mirrors.digitalocean.com/ubuntu bionic-updates/universe amd64 Packages [1054 kB]

When using Management VRF, it is convenient (ie., less typing) to bind the shell to the VRF and let all commands run by it inherit the VRF binding: $ ip vrf exec mgmt su – dsahern

Now all commands run will automatically use Management VRF. This can be done at login using libpamscript[2].

Personally, I like a reminder about the network bindings in my bash prompt. I do that by adding the following to my .bashrc:

NS=$(ip netns identify)
[ -n "$NS" ] && NS=":${NS}"

VRF=$(ip vrf identify)
[ -n "$VRF" ] && VRF=":${VRF}"

And then adding '${NS}${VRF}' after the host in PS1:

PS1='${debian_chroot:+($debian_chroot)}\u@\h${NS}${VRF}:\w\$ '

For example, now the prompt becomes: dsahern@myhost:mgmt:~$

References:

[1] VRF tutorial, Open Source Summit, North America, Sept 2017 http://schd.ws/hosted_files/ossna2017/fe/vrf-tutorial-oss.pdf

[2] VRF helpers, e.g., systemd instances for VRF https://github.com/CumulusNetworks/vrf

[3] Example using VRF in dhclient-exit-hook https://github.com/CumulusNetworks/vrf/blob/master/etc/dhcp/dhclient-exit-hooks.d/vrf

[4] Vincent Bernat informed me that some modules were moved to non-standard package; installing linux-modules-extra-$(uname -r)-generic provides the vrf module. Thanks Vincent.